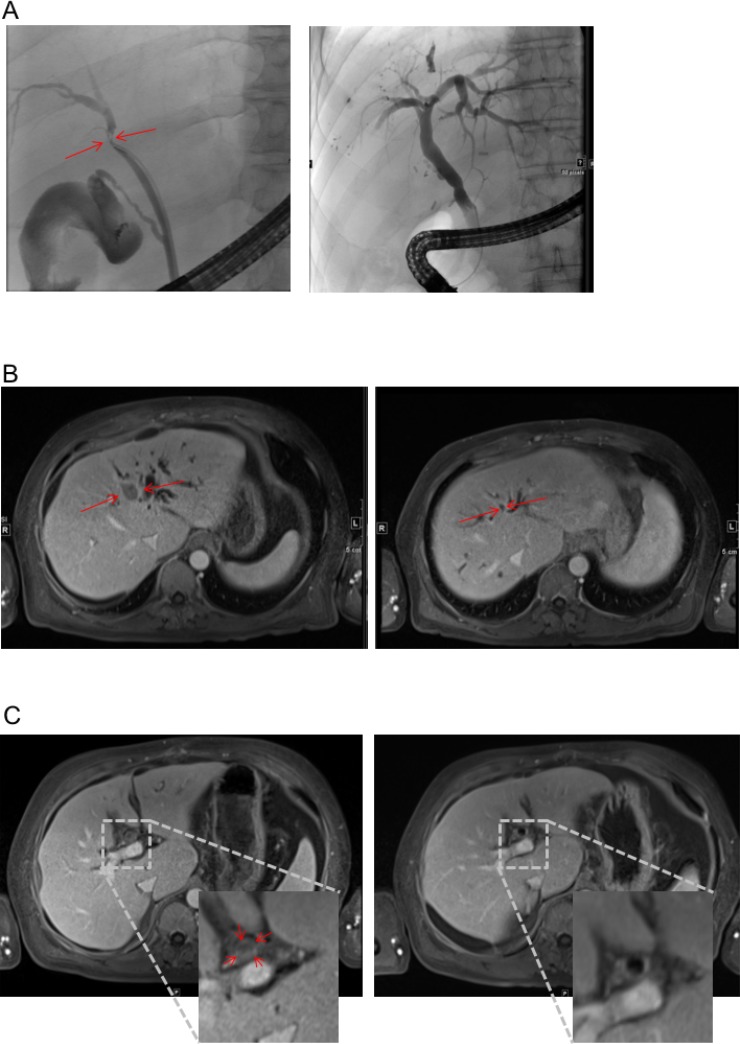
Figure 1. Response to therapy in MRI and ERC.
(A) ERC before placement of endoprothesis (left) and after successful therapy (right). Red Arrow heads indicate index lesion and relevant stenosis respectively. (B and C) MRI scan before (left) and after (right) 6 cycles of treatment according to FOLFOX6 regime. T1-weighted, Enlarged inset shows intraluminal tumor in the bile duct (C left).

