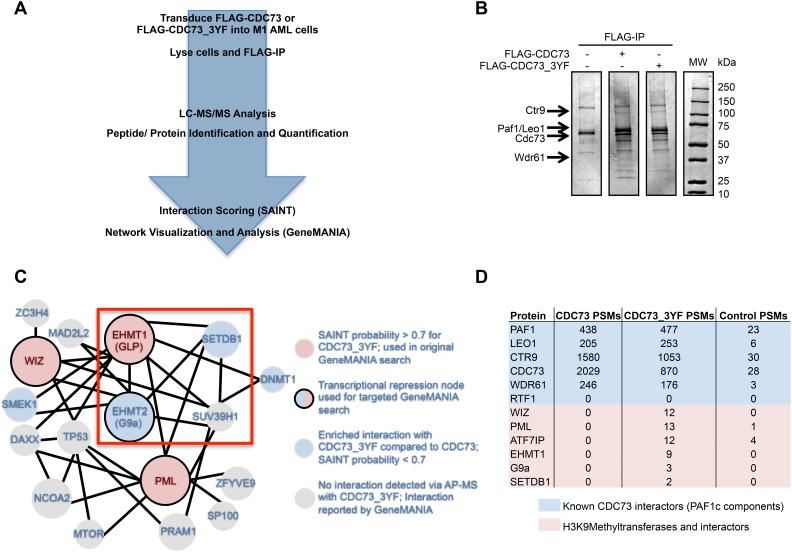
Figure 2. CDC73 and CDC73_3YF have overlapping and distinct interactomes.
(A) Schematic demonstrating the approach for the AP-MS experiment to determine interaction partners of CDC73 and CDC73_3YF in M1 mouse leukemia cells. (B) FLAG-IPs of HEK293T cells transiently transfected with CDC73 or CDC73_3YF were eluted and run on a gel that was stained with Coomassie Blue. Arrows indicate the appropriate size for protein bands for the given PAF1c components. (C) Interaction network for proteins that co-purified with CDC73_3YF adapted from an output from GeneMANIA using the proteins marked by solid borders as a search node. Solid lines connecting proteins indicate a reported physical interaction between two proteins. Circle sizes are proportional to the degree of connectivity to the proteins in the search node. (D) Total peptide spectrum matches (PSMs) for the PAF1c or proteins associated with H3K9 methyltransferase components generated from the AP-MS experiment for either CDC73 (sum of 2 replicates), CDC73_3YF (sum of 3 replicates), or MigR1 control (sum of 3 replicates).

