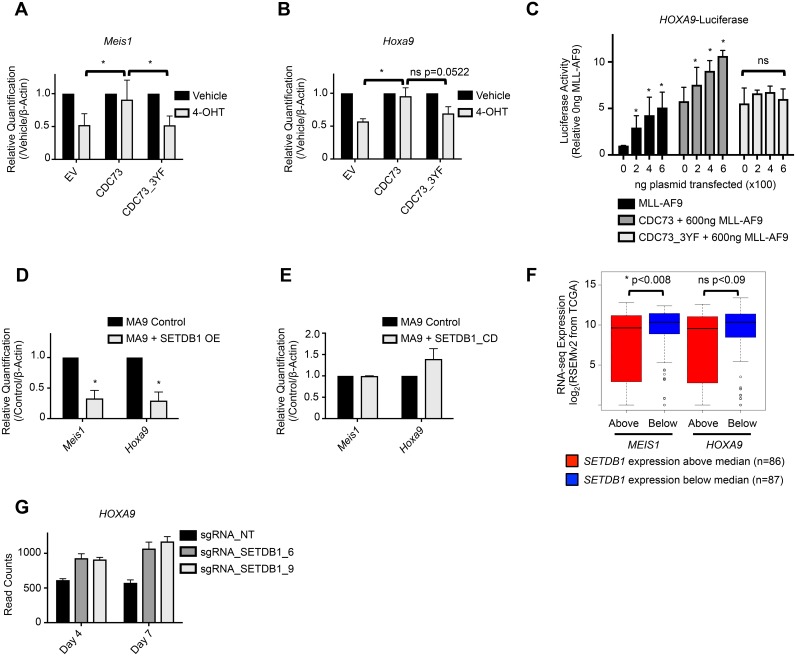
Figure 4. SETDB1 and CDC73_3YF mediated repression of Hoxa9 and Meis1 transcription.
(A-B) MLL-AF9 transformed CDC73fl/fl-CreERT2 CDC73 re-expression cells were plated in the presence or absence of 4-OHT and RNA was collected after 48 hours. qPCR was performed to detect expression of Meis1 or Hoxa9. 4-OHT treated group was normalized to vehicle treated group for each cell type. Error bars represent standard deviations of the biological replicates (biological replicates n=5, n=3, respectively; 3 technical replicates each). Welch’s two-tailed unpaired t-test was used to compare the gene expression of the 4-OHT treated groups, using CDC73 re-expression as the control. (C) HEK293T cells were transiently transfected with the indicated plasmids, Hoxa9 luciferase, and Firefly-Renilla. Luminescence readings were taken at 48 hours and plotted relative to empty vector control transfections. Statistics were calculated using 2-way ANOVA with post-hoc Dunnett’s testing (biological replicates n=5; 3 technical replicates each). (D-E) qPCR detection of Meis1 and Hoxa9 expression in MLL-AF9 control cells or MLL-AF9 co-transduced with (D) SETDB1 or (E) SETDB1_CD overexpression vector. Welch’s two-tailed unpaired t-test was used to compare the gene expression relative to β-actin housekeeping gene of the SETDB1 overexpression cells compared to control. SETDB1 or SETDB1_CD overexpression groups were normalized to their concurrently made control cell line groups. Error bars represent standard deviations of the biological replicates (biological replicates n=2-3; 3 technical replicates each). (F) RNA-seq data, downloaded through the cBioPortal analytical tool, was deposited to the TCGA by Ley et al. [57, 70, 71]. Data was mined for expression correlation between SETDB1 and MEIS1 or HOXA9. Patient samples were divided into SETDB1 expression higher than the median and those that were lower, and the gene of interest expression was plotted on the y-axis. Statistical significance was analyzed using the Mann-Whitney-Wilcoxon test. (G) RNA-seq data, downloaded through the Gene Expression Omnibus (GEO), was deposited by Cuellar et al [58, 72]. Data was mined for HOXA9 expression in human THP1 cells expressing Cas9 and one of two small guide RNAs (sgRNA_SETDB1_6 and sgRNA_SETDB1_9) designed to interfere with SETDB1 expression. Control cells expressed Cas9 and a non-targeting sgRNA (sgRNA_NT). RNA was collected and sequenced at two different time points- 4 days after introduction of the sgRNA and 7 days after introduction of the sgRNA. Each bar is the average of three biological replicates and the error bar represents the standard deviation. *p<0.05; EV = Empty Vector control (MigR1); OE = Overexpression.

