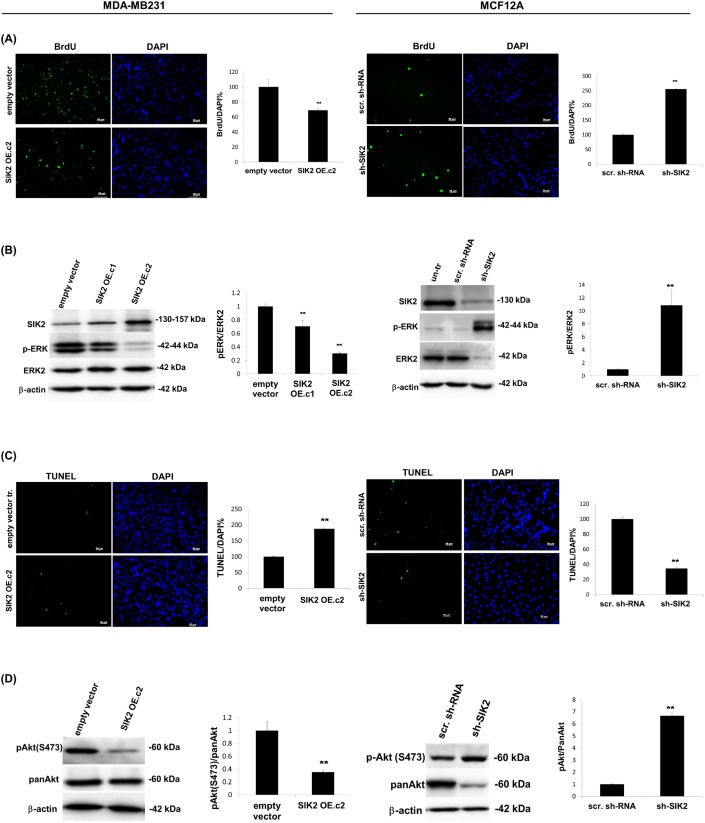
Figure 2. SIK2 inhibits proliferation and survival of breast cells with parallel downregulation of MAPK and PI3K/Akt signaling pathways.
SIK2 expression was modulated in MDA-MB-231 cells by transfection with full-length SIK2, and in MCF12A cells by transduction with lentivirus carrying sh-SIK2. Empty vector transfection or scrambled sh-RNA transduction constituted the controls, respectively. The left panels represent data from MDA-MB-231 and the right panels from MCF12A cell lines. (A) Proliferation was assessed by BrdU incorporation assay subsequent to FGF2 (1 ng/ml) treatment of cells, serum starved overnight. (B) Changes in active Erk levels in two different clones of SIK2 OE cells; expressing low (SIK2 OE. c1) and high (SIK2 OE. c2) levels of SIK2, compared to empty vector-transfected cells were evaluated by Western blotting. p-ERK band intensities were normalized to that of ERK in the same samples. SIK2 OE. c2 was used for further overexpression studies. (C) TUNEL assay was performed on cells that were serum starved overnight. (D) Changes in active Akt levels in serum starved, SIK2 OE cells as compared to empty vector-transfected cells by Western blotting. p-Akt band intensities were normalized to that of pan-Akt in the same samples. Bar graphs represent the mean values of at least 3 independent biological samples (± SD). In BrdU and TUNEL assays, cell nuclei were visualized by DAPI staining and in each sample at least 200 cells were counted. **P < 0.001 and the Scale bar=50um.

