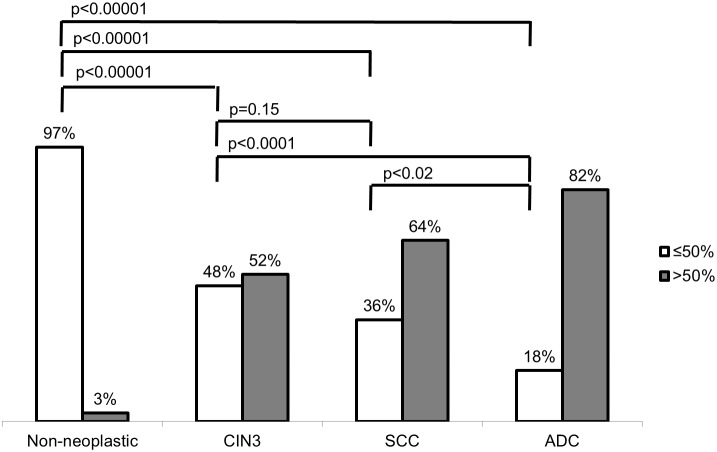
Figure 4. Comparative analysis of SOD2 expression in cervical samples.
SOD2 staining was determined as strong when positive in more than 50% of cells and weak or moderate when positive in less than 50% of cells. Strong SOD 2 expression was associated with cervical intraepithelial neoplasia and carcinoma when compared to non-neoplastic tissues. It was also associated with Adenocarcinoma (ADC) when compared to Squamous Cells Carcinoma (SCC) and Cervical Intraepithelial Neoplasia (CIN3). Statistical analysis was performed by the Fisher Exact test.

