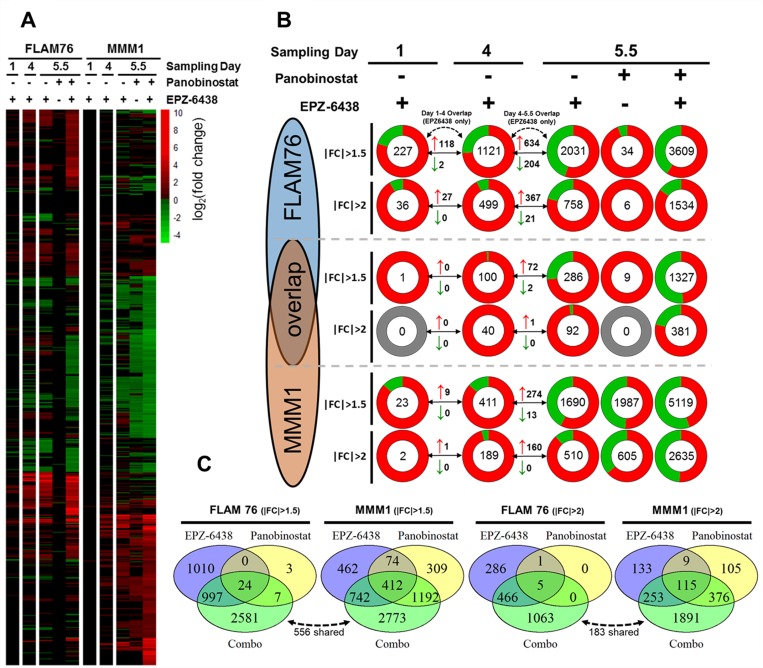
Figure 3. Transcriptomic profiling of EPZ-6438/panobinostat single agents and combination.
(A) All significant (FDR < 0.05, FPKM ≥ 1) gene expression changes for two HMCLs (FLAM76 & MMM1) treated with EPZ-6438 (5 μM for 1, 4 or 5.5 days) and/or panobinostat (FLAM76-3 nM;MMM1-20 nM for 1.5 days after 4 days EPZ-6438/media pre-treatment). Infinite/negative-infinite fold change values (i.e. 0 FPKM relative to 10 FPKM) display the same color saturation as the finite minimum or maximum fold change value. (B) Pie charts each representing the total number (center) of upregulated (red) and downregulated (green) genes (FDR < 0.05, FPKM ≥ 1) for each treatment condition. At each condition two fold change thresholds are displayed (|FC|≥2 above and |FC|≥2 below) for both HMCLs as well as for the overlap in significant gene expression changes for each condition/threshold between the two HMCLs. Arrowed lines between sampling days display the number of upregulated (red arrow) and downregulated (green arrow) genes shared between the three different EPZ-6438 single agent sampling times. (C) Venn Diagrams displaying genes shared between the day 5.5 EPZ-6438, panobinostat and combo differential expression conditions as well as the genes unique to the combination. The dotted arrow/number represent genes unique to the combination that are shared between the two HMCLs.

