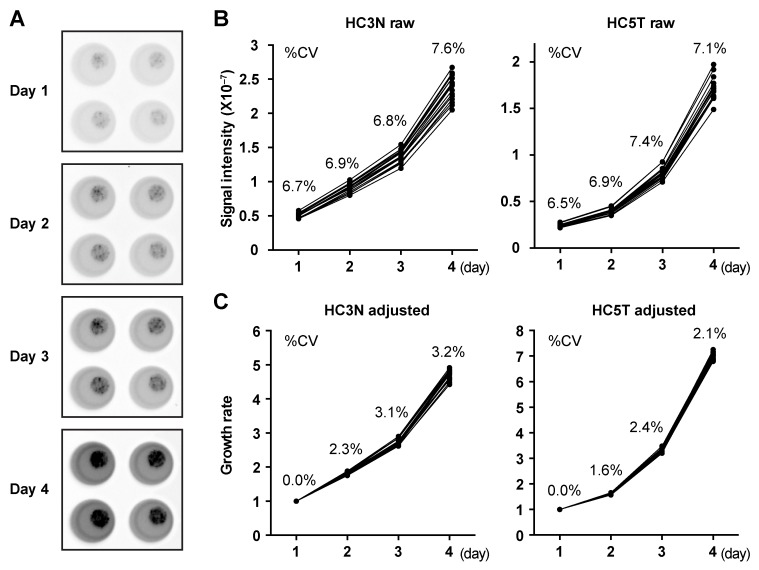
Figure 2. An accurate growth-monitoring method for human spheroids.
(A) Quantitative presentation of bioluminescence from luciferase-expressing spheroids from days 1 to 4 after passages into the wells of a 96-well cell culture plate. The gray level in each well represents direct photon counts for the spheroids embedded in the corresponding Matrigel drop. The total luminescence represents the cell number in each well. (B, C) Growth monitoring of luciferase-expressing spheroids. Photon counts from spheroid lines derived from normal (HC3N raw; left) and cancer (HC5T raw; right) SCs were scored daily during post-passage days 1–4 (B). Graphs in (C) show growth rates calibrated to the initial cell numbers based on the photon counts on day 1. Sixteen replicated wells were tested for each line. The coefficient of variation (%CV) is shown for each data point.

