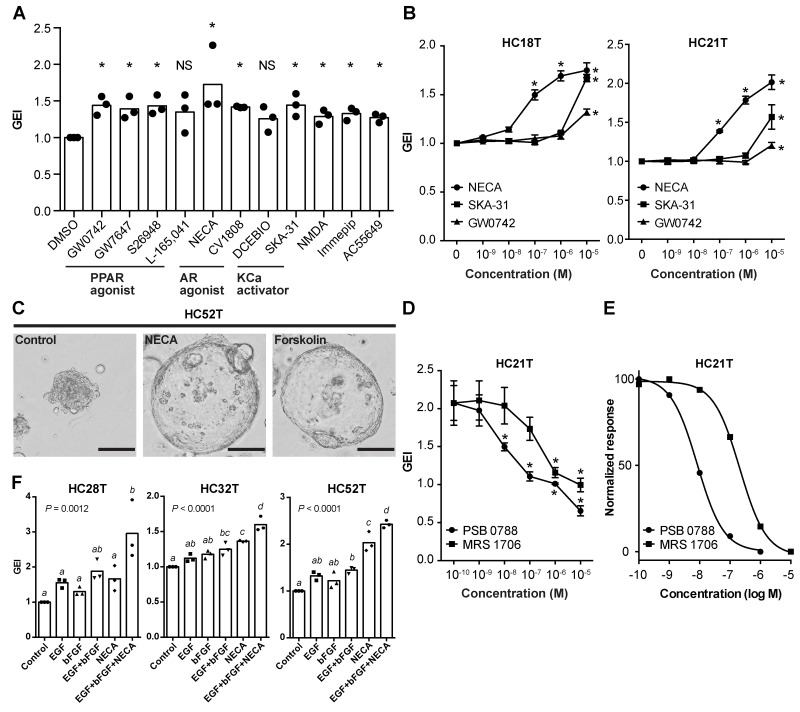
Figure 6. Evaluation of chemical compounds that facilitate the growth of CRC-TIC spheroids.
(A) Growth-promoting effects of the compounds identified in Figure 5B. Shown are the data sets with mean values > 1.25 (i.e., > 25% increase in growth). More than one compounds in each of three groups showed growth stimulation: peroxisome proliferator-activated receptor agonist (PPAR agonist); adenosine receptor agonist (AR agonist); calcium-activated potassium channel activator (KCa activator). Plotted are the GEI with means in three independent spheroid lines. Asterisks indicate statistically significant differences from the solvent-only (0 μM) spheroids (P < 0.05; analyzed using Student’s t-test). ND, no significant difference. (B) Dose-dependent effects of the selected three compounds on the growths of two colorectal cancer spheroid lines (HC18T and HC21T). Shown are the mean GEI ± SD in three independent experiments. Asterisks indicate statistically significant differences from the solvent-only (0 μM) spheroids (P < 0.05; analyzed using one-way ANOVA followed by Tukey’s post-test). (C) Representative phase-contrast micrographs of spheroids after NECA or forskolin treatment. Colorectal cancer spheroids (HC52T) were cultured with solvent only, 1 μM NECA, or 1 μM forskolin for five days. Note the increased sizes of NECA- and forskolin-treated spheroids caused by cell flattening. Scale bar, 100 μm. (D, E) Dose-dependent inhibitory effects of adenosine receptor antagonists (PSC 0788 and MRS 1706) on the growth of CRC-TIC spheroids (HC21T) cultured in the presence of 1 μM NECA. Shown are the mean GEI ± SD (D) and fitted curves of the normalized mean values (E) in three independent experiments. Asterisks in (D) indicate statistically significant differences from the solvent-only (0 μM) spheroids (P < 0.05; analyzed using one-way ANOVA followed by Tukey’s post-test). (F) Growth stimulation by three supplementary factors on slow-growing spheroid lines. Luciferase-expressing spheroids were cultured in the presence of the indicated factor(s) for 3 days. Plotted are the GEI with means in three independent experiments calculated from the same data sets in Supplementary Figure 3E. Data were analyzed using one-way ANOVA (P values are shown in the graphs) followed by Tukey’s post-test. The mean values between the different letters are statistically different (P < 0.05).

