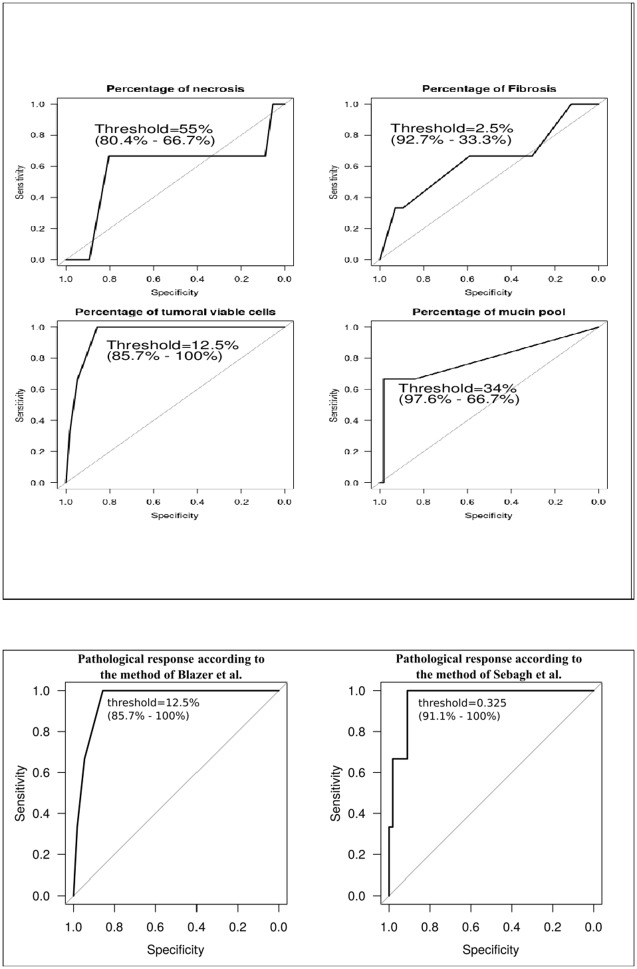
Figure 3. Relationship between the presence of intratumoral genetic heterogeneity and pathological variables in the overall population.
The better threshold was 34% (specificity of 97.6%; sensitivity of 66.7%) for the rate of mucin pools, 12.5% for the rate of viable tumor cells as well as for the pathological response according to the method by Blazer (specificity of 85.7%; sensitivity of 100%) and 0.3 cm-residual tumor for the pathological response according to the method by Sebagh (specificity of 91.1%; sensitivity of 100%).

