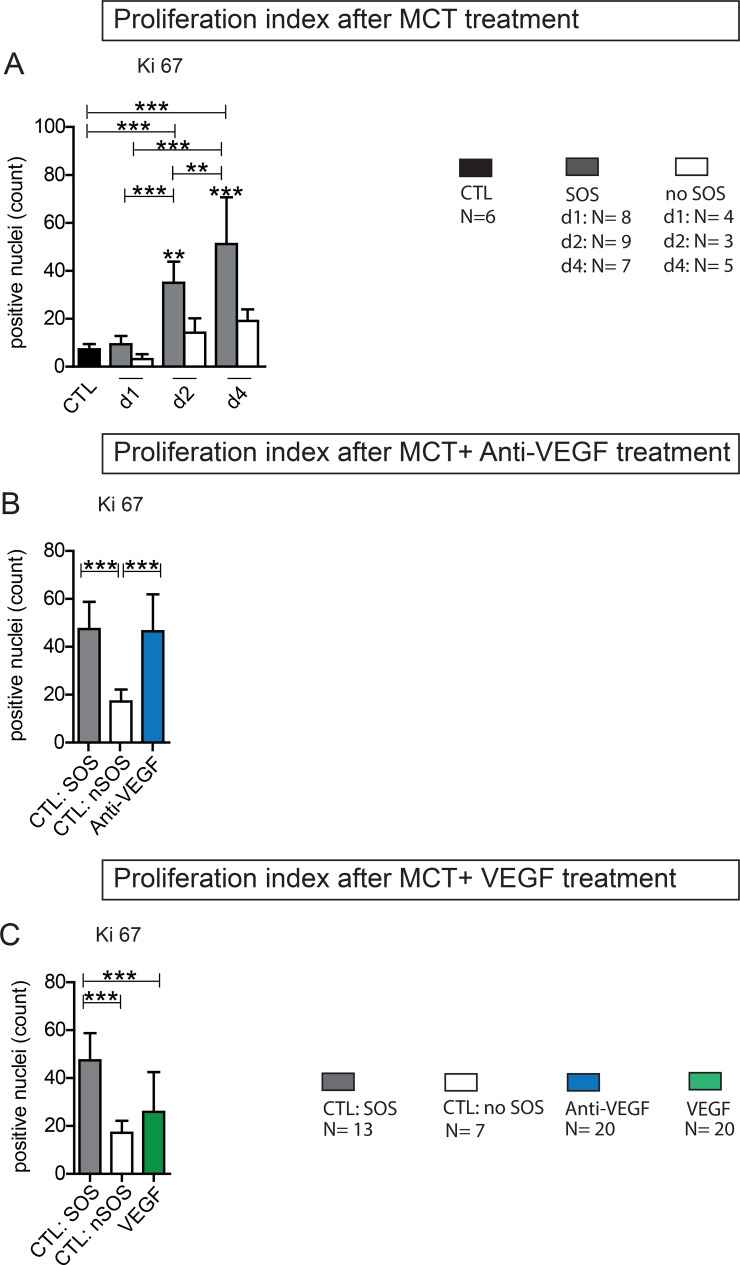
Figure 6. Ki 67 Proliferation index.
Ki 67 staining on liver tissue was performed and the positive cells were counted (from each section 3 perivenular and three periportal areas with 92332 µm2); (A) Results from group PG 1; Animals were treated with MCT and sacrificed at day 1, 2 or 4. Histological examination of liver tissue determined wether or not SOS characteristics occurred. According to these results animals were divided in group SOS and no SOS (CTL control group); (B) Results from group Anti-VEGF 1 and 2; Animals were treated with MCT and additionally received either simultaneously or after 24 h Anti-VEGF. Liver tissue was collected after 96 h. (C) Results from group VEGF 1 and 2; Animals were treated with MCT and additionally received either simultaneously or after 24 h VEGF; Major significances are shown; *p < 0,05; **p < 0,005; ***p < 0,001.

