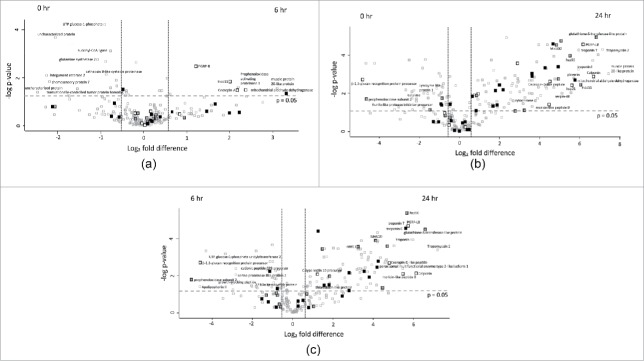
Figure 5.
Volcano plots of all identified proteins based on relative abundance differences between G. mellonella larvae treated at 0, 6 or 24 hour. Volcano plots showing the distribution of quantified proteins according to p value (−log10 p-value) and fold change (log2 mean LFQ intensity difference). Proteins above the line are considered statistically significant (p value < 0.05) and those to the right and left of the vertical lines indicate relative fold changes ± 1.5. The top 20 differentially abundant proteins are annotated and all proteins associated with the stress response (grey), immune response (white) and oxidoreductase activity (black) are highlighted for (5A) 6 hour and 0 hour, (5B) 24 hour and 0 hour and (5C) 24 hour and 6 hour C. albicans treated larvae.

