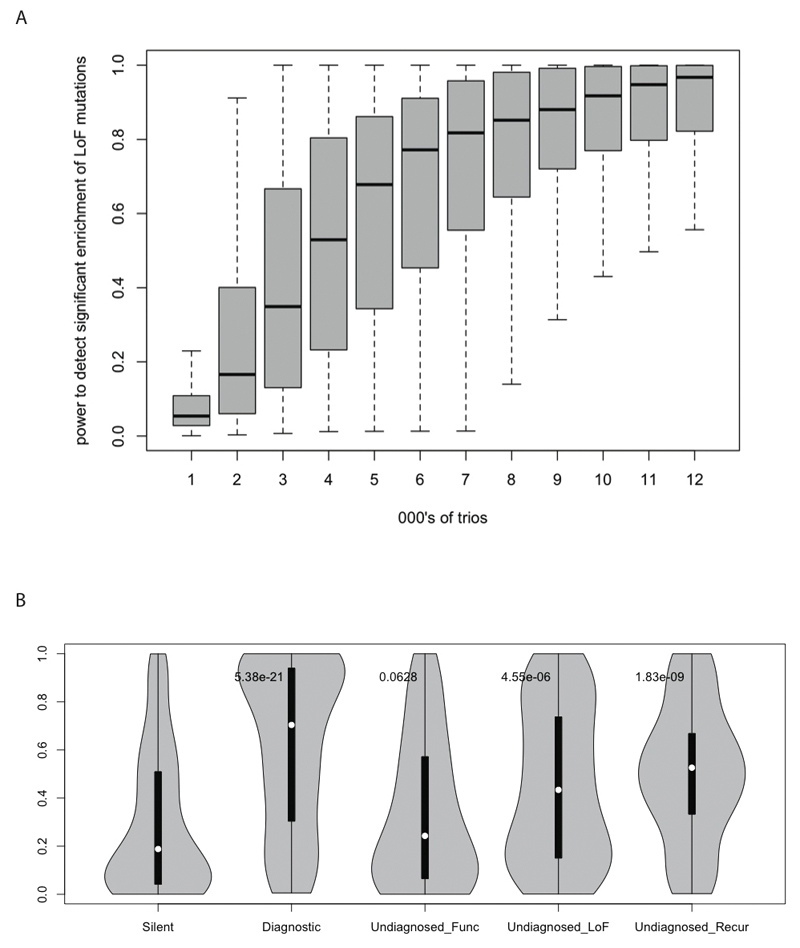
EDF6. Haploinsufficiency analyses.
A. Saturation analysis for detecting haploinsufficient DD genes. A boxplot showing the distribution of statistical power to detect a significant enrichment of LoF mutations across 18,272 genes in the genome, for different numbers of trios studied, from 1,000 trios to 12,000 trios. B. Distribution of haplinsufficiency scores in selected sets of de novo mutations. Violin plot of haploinsufficiency scores in five sets of de novo mutations: Silent - all synonymous mutations, Diagnostic - mutations in known DD genes in diagnosed individuals, Undiagnosed_Func - all functional mutations in undiagnosed individuals, Undiagnosed_LoF - All LoF mutations in undiagnosed individuals, Undiagnosed_recur - mutations in genes with recurrent functional mutations in undiagnosed individuals. P values for a Mann-Whitney test comparing each of the latter four distributions to that observed for the silent (synonymous) variants are plotted at the top of each violin.

