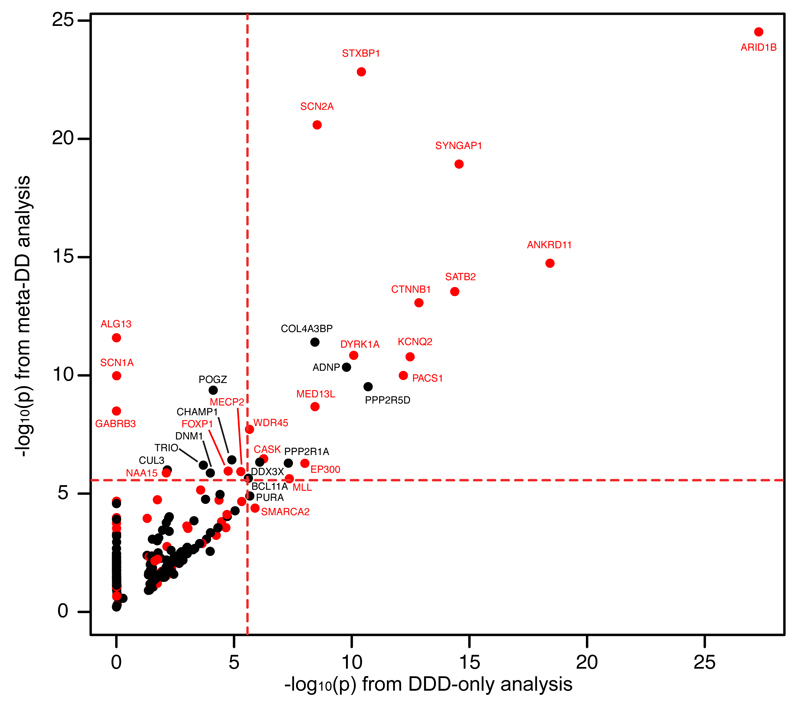
Figure 2. Gene-specific significance of enrichment for DNMs.
The –log10(p) value of testing for mutation enrichment is plotted only for each gene with at least one mutation in DDD children. On the X-axis is the p value of the most significant test in the DDD dataset, and on the Y-axis is the minimal p value from the significance testing in the meta-analysis dataset. Red indicates genes already known to be associated with DDs (in DDG2P). Only genes with a p value of less than 0.05/18,272 (red lines) are labeled.

