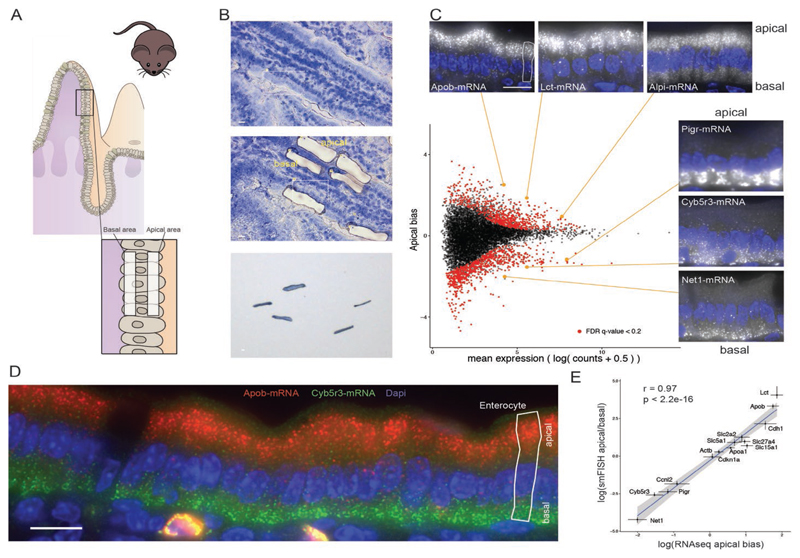
Fig. 1. Global analysis of mRNA polarization in the intestinal epithelium.
(A) Laser capture microdissection of paired apical and basal fragments. (B) RNA-seq data of isolated subcellular areas. Insets show smFISH validation results of transcripts of interest. Four outlier data points are omitted from the plot. Of the transcripts, 645 of 9905 are significantly apical and 779 of 9905 are significantly basal. Dashed vertical line separates the 2000 most highly expressed transcripts, of which 392 genes are significantly apical and 194 are significantly basal. (C) smFISH staining of the apical Apob (red) and basal Cyb5r3 (green) mRNA. (D) Strong correlation of smFISH quantifications and RNAseq data for 14 representative genes (Spearman’s r = 0.97, P < 2.2 × 10⁻¹⁶); dots and error bars represent median and 95% confidence interval of smFISH and mean and SE of RNAseq. All scale bars are 10 μm.

