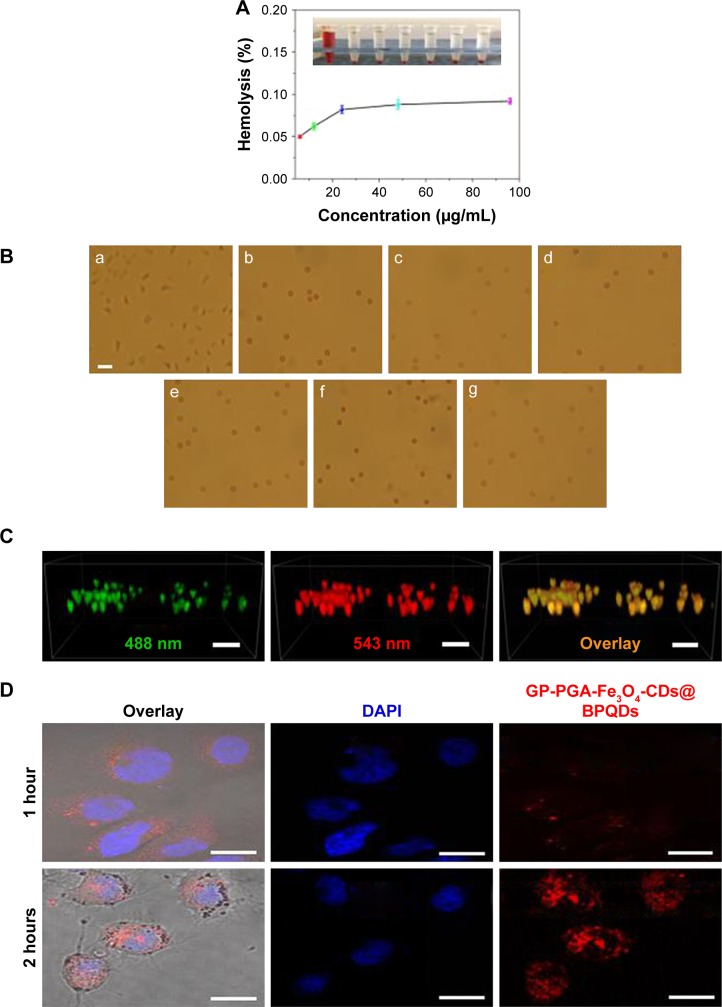
Figure 4.
Blood biocompatibility and cell imaging of GP-PGA-Fe3O4-CDs@BPQDs nanoplatform.
Notes: (A) Hemolysis percentages of RBCs by GP-PGA-Fe3O4-CDs@BPQDs at different concentrations (upper right). Inset, supernatant from the GP-PGA-Fe3O4-CD@BPQD suspensions. (B) Optical images of RBCs treated with GP-PGA-Fe3O4-CDs@BPQDs: a, positive control (deionized water); b, negative control (PBS); c–f, 6.25–100 μg/mL. Scale bar =25 μm. (C) 3D reconstruction of the colocalization of GP-PGA-Fe3O4-CDs@BPQDs inside HepG2 cells after 12 hours. Scale bar =50 μm. (D) Confocal fluorescence images for photoexcitation of internalized red-emitting GP-PGA-Fe3O4-CDs@BPQDs in HeLa cells. Scale bar =25 μm.
Abbreviations: RBCs, red blood cells; GP, genipin; PGA, polyglutamic acid; CDs, carbon dots; BPQDs, black phosphorus quantum dots; DAPI, 4,6-diamidino-2-phenylindole.

