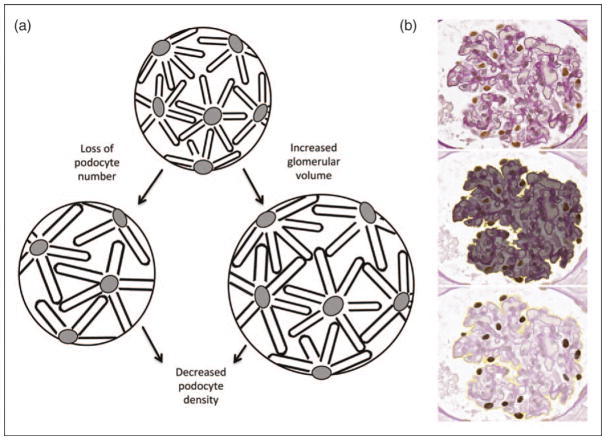
FIGURE 4.
Podometrics. (a) The cartoon illustrates the events leading to a reduction in relative or absolute podocyte density, resulting in glomerulosclerosis. When podocytes are lost or the glomerular size increases, podocytes become hypertrophic in an attempt to maintain the filtration barrier, resulting in a decrease in podocyte density. When the threshold of hypertrophic stress and loss of adaptive capacity is reached, podocytes detach, resulting in progressive podocytopenia. (b) From a glomerulus (upper panel), measurements of tuft area (middle panel) and podocyte features (bottom panel) can be obtained from a single section stained with periodic acid–Schiff and immunohistochemistry for Wilm’s Tumor 1 by employing National Institute of Health ImageJ software. With this modified protocol based on the measurements are then used to calculate podocyte density per glomerular volume. (Histology images kindly provided by Chris O’Connor and Markus Bitzer at the University of Michigan, Division of Nephrology) [47].

