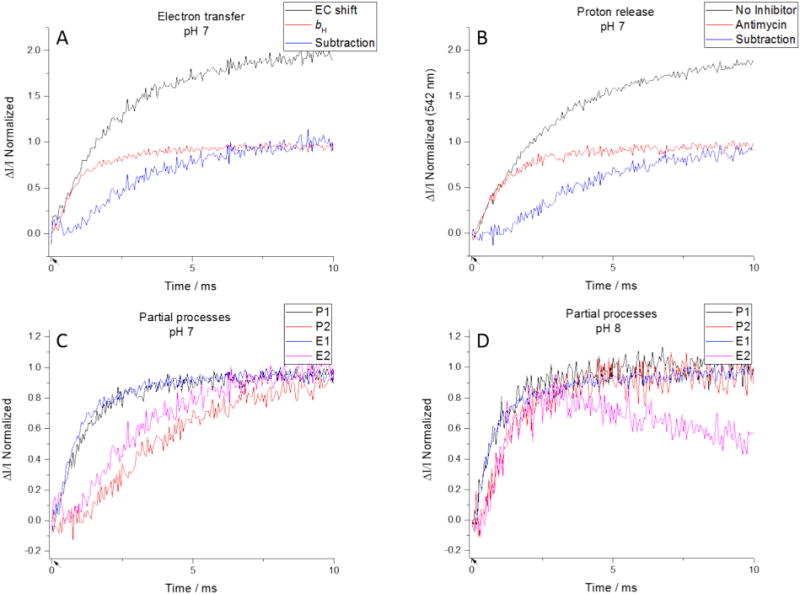
Fig. 6.

Isolation of partial processes. (Top) Kinetics of turnover can be examined using electron transfer (left) or proton release (right). The uninhibited traces (black) represent the kinetics of two turnovers. Antimycin limits the Qo-site to a single turnover (red), so subtracting the latter from the former isolates the electron transfer or proton release from the second turnover. (Bottom) Plotting the proton and electron transfers at a particular pH together, we see a good agreement for the first partial processes, and a pH-dependent agreement for the second partial processes. (Flashes indicated by arrows on time axis.)
