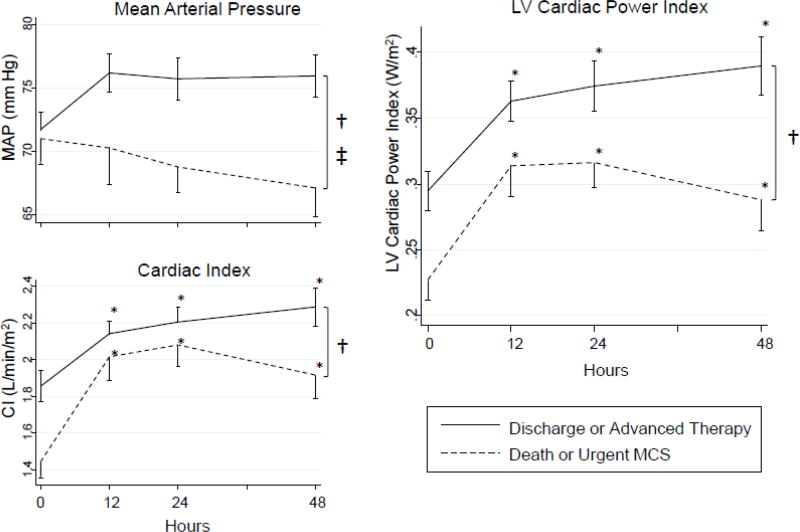
Figure 3. LVCPI Trend by Adverse Outcome Status.
Mean ± standard deviation at each time point is noted; time points were compared by two-way repeated measures analysis of variance. * significant difference versus 0 hour time point (P < 0.001); † significant difference between groups (P < 0.0001); ‡ significant effect of time/interaction term (P < 0.05). Those who suffered an adverse outcome (death or urgent MCS) had significantly lower mean arterial pressure (MAP) and cardiac index (CI) despite IABP insertion when compared to those who survived to hospital discharge or advanced therapies (LVAD/OHT). As a result, LVCPI, which is calculated from the product of MAP and CI, was significantly lower in those who suffered an adverse outcome than in those who survived to hospital discharge or advanced therapies.

