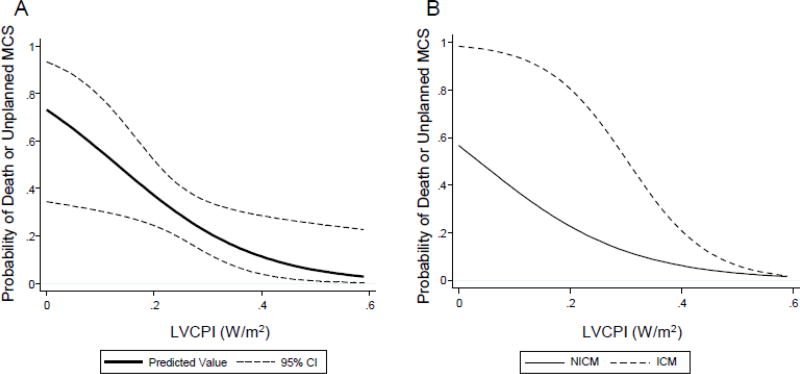
Figure 4. Probability of Adverse Events based on LVCPI.
(A) Hazard function was plotted of probability of adverse event (with 95% confidence interval) versus left ventricular cardiac power index (LVCPI). Adverse events were inversely related to LVCPI at time of IABP insertion. (B) Hazard function plot stratified by history of ischemic cardiomyopathy (ICM) versus non-ischemic cardiomyopathy (NICM). ICM history led to significantly higher probability of adverse events over a wide range of LVCPI when compared to NICM.

