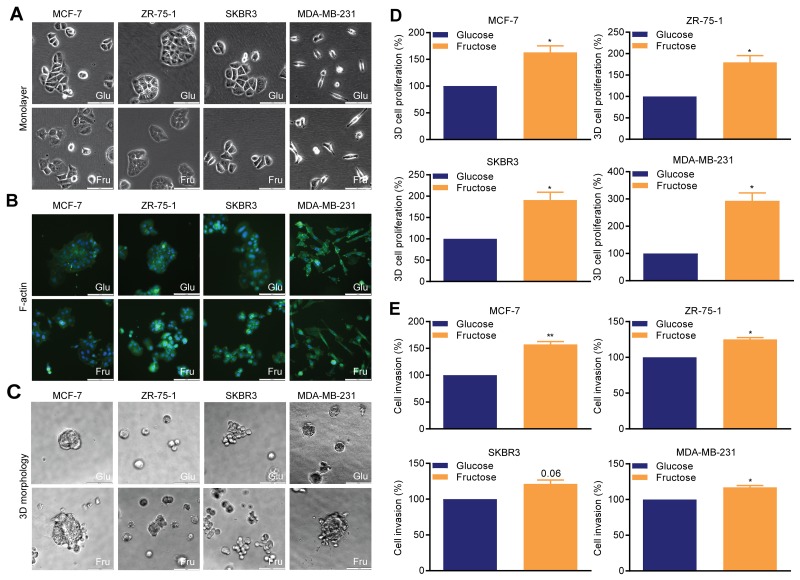
Figure 2. Restricted glycolysis alters cellular morphology and invasiveness in breast cancer cells.
(A-C) Cellular morphology (bar 100 μm). (A) monolayer adherent cells, (B) organization of F-actin (phalloidin-FITC), (C) 3D matrigel colonies. (D) 3D matrigel cell growth. (E) Cellinvasion assay. Mean invasionefficiency of the glucose-cultured cells was MCF-7 0.77%, ZR-75-1 1.25%, SKBR3 1.85% (all48 hour assays) and MDA-MB-231 4.2% (24 hour assays). Invasion efficiency is calculated in relation to the total number of cell plated. Representative images of invasion assays are shown in Supplementary Figure 2. (D, E) One sample t-test.

