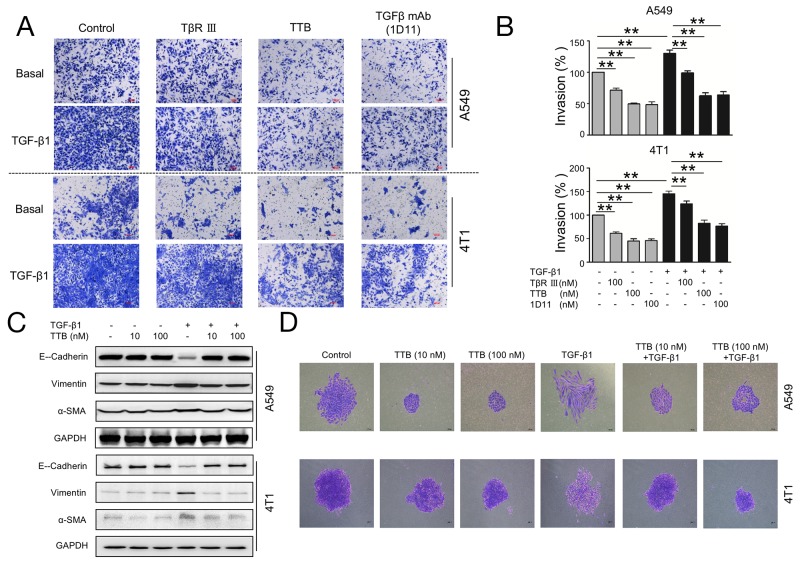
Figure 4. TTB inhibits cancer cells invasion and EMT.
(A) Invasion assay was performed as described in the Methods and Materials. A549 and 4T1 cells were cultured alone, 100nM of TβRIII, TTB or TGFβ mAb(1D11), with or without TGF-β1 (20pM).. Representative images were shown. (B) Bar graph of the invasion assay. The data represented the normalized values of the number of invaded colonies against control groups. The data are shown as the mean ± SEM with **P<0.01. c). (C) The biomarker expression during TGF-β1 treatment. A549 and 4T1 cancer cells were incubated with TGF-β1 in the presence or absence of TTB for 2 days. The protein levels of E-Cadherin, Vimentin and α-SMA, were determined by Western blot. (D) Single A549 or 4T1 cancer cell was incubated with TGF-β1 in the presence or absence of TTB for 7 days and 2 days, respectively. The cells were then fixed and images obtained under a microscopy at 100 × magnification. Representative images were shown here.

