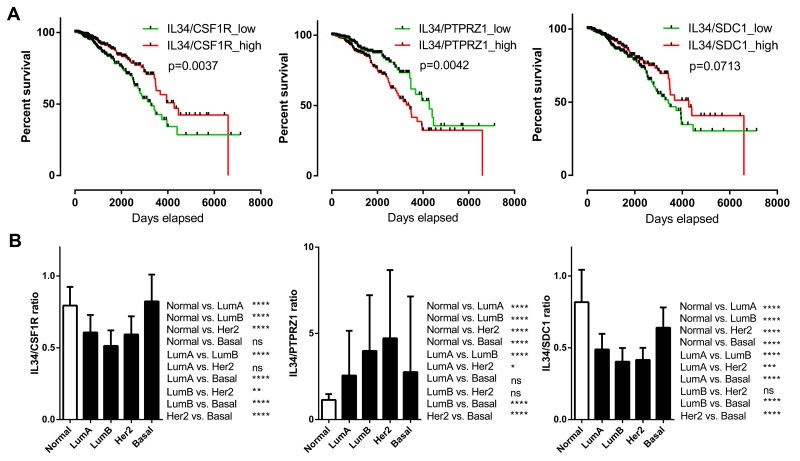
Figure 6. IL-34 ligand-receptor mRNA expression ratio.
(A) Kaplan–Meier plots of overall survival between IL-34/CSF1R, IL-34/PTPRZ1, and IL-34/SDC1 mRNA ratio high and low breast cancer patients (n = 1056) of the TCGA BRCA dataset. Median expression values were used as cut-offs for group separation. Log rank tests were calculated. (B) IL-34/CSF1R, IL-34/PTPRZ1, and IL-34/SDC1 mRNA ratio median values in normal breast tissue and in PAM50 breast cancer subclasses. The bar graph shows the IL-34/receptor mRNA ratio across normal breast tissue (n = 113) and the molecular subtypes of breast cancer (luminal A, n = 412; luminal B, n = 188; HER2-enriched, n = 64; basal, n = 140) of the TCGA BRCA dataset. Kruskal–Wallis and Dunn’s multiple comparison tests were calculated. Error bars indicate standard deviations. *, p < 0.05; **, p < 0.01; ***, p < 0.001; ****, p < 0.0001.

