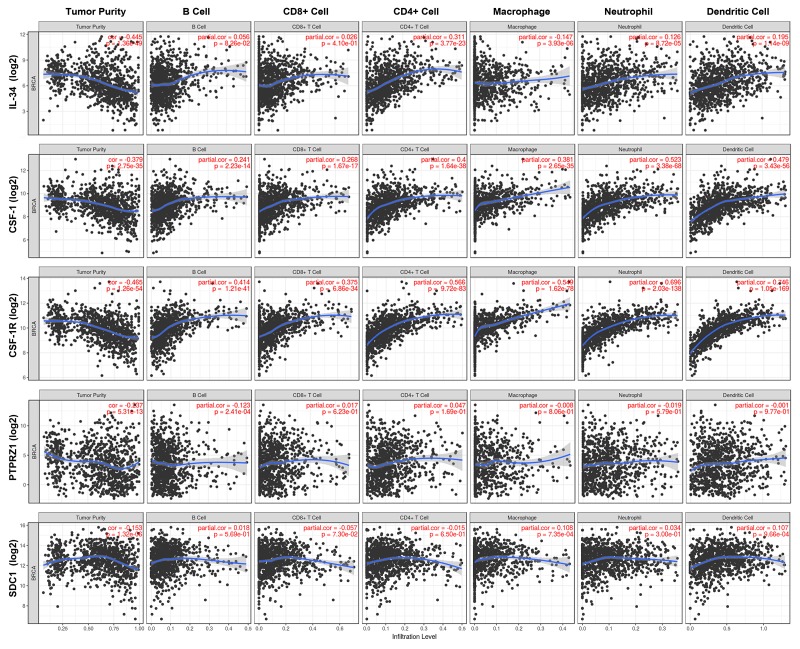
Figure 7. Immune cell landscape of breast cancer compared with TCGA gene expression of IL-34, CSF-1, CSF-1R, PTPRZ1, and SDC1 (syndecan-1).
Scatter plots were generated using the online tool TIMER to identify different profiles of immune cells associated with investigated genes. Each dot represents a single tumor sample. (see also Table 5, Supplementary Table 1).

