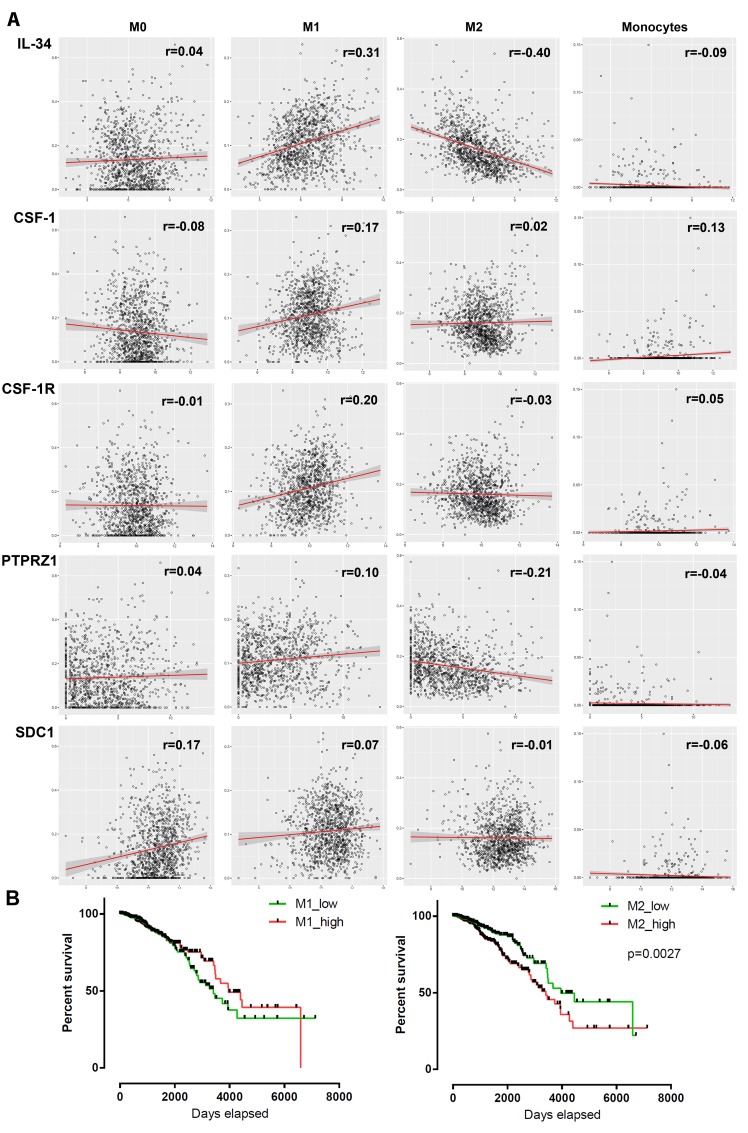
Figure 8. Association between mRNA expression of 5 genes and macrophage infiltration in breast tumors.
(A) Scatter plots show the correlation between IL-34, CSF-1, CSF-1R, PTPRZ1 and SDC1 mRNA expression (log2 scale) and M0, M1, M2 and monocyte infiltration scores (obtained from TCIA database) in tumor samples from the TCGA BRCA dataset. Each circle represents a single tumor sample. Regression lines and confidence intervals are shown in red and grey, respectively. (B) Kaplan–Meier plots of overall survival between M1/M2 high and low infiltrated breast cancer patients (n = 1052) of the TCGA BRCA dataset. Median macrophage scores from TCIA database were used as cut-offs for group separation. Log rank tests were calculated.

