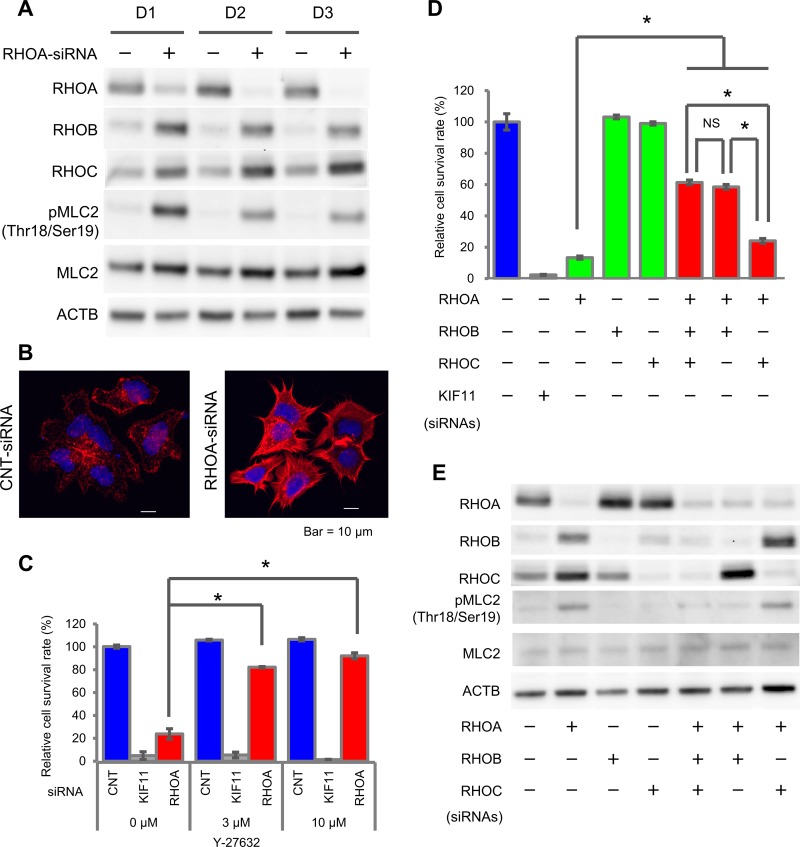
Figure 3. Activation of ROCK signaling by RHOA knockdown in SW948.
(A) Expression of RHOA, RHOB, and RHOC, and phosphorylation of MLC2 in SW948 treated with 1 nM of RHOA-siRNA. Proteins were harvested on days 1, 2, and 3 after siRNA treatment. The protein expression levels were detected using western blotting. (B) Actin stress fibers of SW948 treated with 1 nM of RHOA-siRNA. Actin stress fibers were stained with Rhodamine Phalloidin, and DAPI was used for nuclear staining. Stained cells were analyzed with confocal fluorescence microscopy. Representative images of three independent chambers are shown. Details of immunocytochemistry are described in Materials and Methods. Scale bar shows 10 μm. (C) Restoration of cell survival by a ROCK inhibitor, Y-27632. SW948 was cultivated for 7 days with 3 μM or 10 μM of Y-27632. The relative cell survival rate is shown as a percentage of that in the control-siRNA-treated SW948 that was not treated with Y-27632. Data are shown as mean ± SD (n = 3). Significance compared with the Y-27632 non-treated group between RHOA-siRNA-treated groups was determined by Student’s t-test. *p < 0.05. (D) Restoration of cell survival by RHOB/RHOC-siRNAs. SW948 was cultivated for 7 days with RHOA-siRNA (1 μM) and/or RHOB-siRNA (1 μM) and/or RHOC-siRNA (0.2 μM). Cell survival rate of obtained transfectants was evaluated as described in Figure 1. Data are shown as mean ± SD (n = 3). Significant differences between RHO-siRNA-treated groups were determined by Student’s t-test. *p < 0.05. (E) Protein expression of cells tested in (D).

