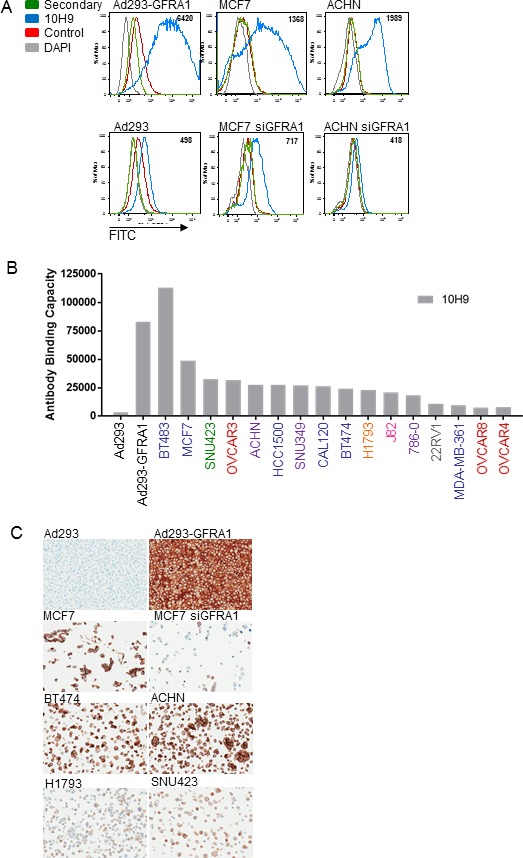
Figure 2. Anti-GFRA1 antibodies demonstrate specificity in model systems.

(A) Demonstration of anti-GFRA1 mAb 10H9 specificity by FACS binding to target-positive and target-negative model systems. (B) Evaluation of GFRA1 receptor density on the cell surface of cancer cell lines using antibody 10H9. Tissue of origin of each line is defined by color coding of of their names: embryonic kidney = black, mammary carcinoma = blue, hepatocellular carcinoma = green, ovarian carcinoma = red, renal cell carcinoma = purple, lung adenocarcinoma = orange, bladder carcinoma = pink, prostate carcinoma = grey. (C) IHC specificity of the anti-GFRA1 mAb 4D12. FACS, fluorescence-activated cell sorting; IHC, immunohistochemistry; mAb, monoclonal antibody.
