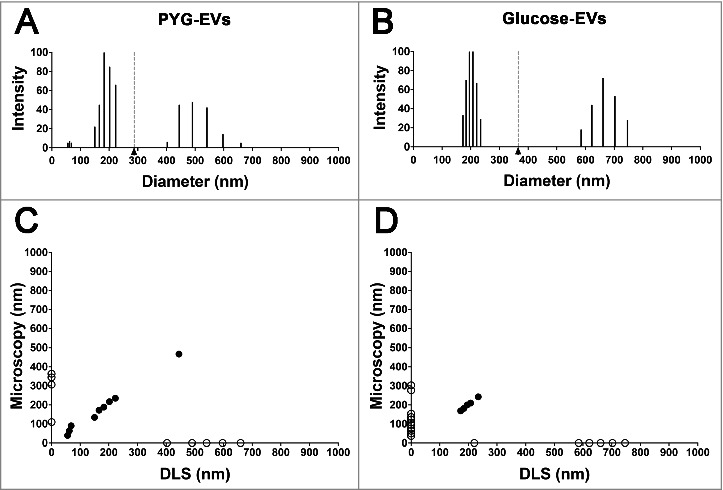
Figure 2.

Characterization of the EVs’ populations secreted by A. castellanii by dynamic light scattering (DLS). The graphs are representative of the two replicates displaying similar results. EVs secreted and isolated from A. castellanii grown in (A) PYG (PYG-EVs, total average of 287.7 ± 154.8 nm, black arrow and gray dashed line) and (B) glucose medium (glucose-EVs, total average of 365.1 ± 224.6 nm, black arrow and gray dashed line). (C and D) Correlation of the diameters obtained by electron microscopy and DLS of EVs isolated from A. castellanii grown in (C) PYG (PYG-EVs) and (D) glucose medium (glucose-EVs). Open circles (○) indicates EVs populations identified in only one of the size measurement methodology, whereas closed circles (•) indicates EVs populations identified in both methods.
