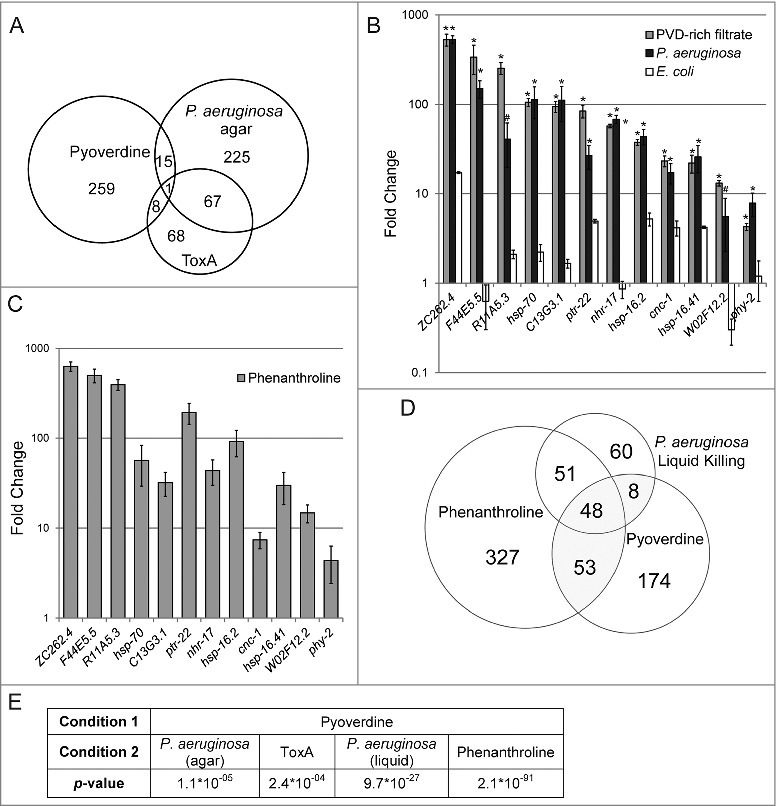
Figure 4.

Pyoverdine exposure activates a distinct host response. (A) A Venn diagram of genes upregulated after exposure to pyoverdine and P. aeruginosa infection on agar and ToxA. (B) qRT-PCR analysis of a panel of genes upregulated by exposure to pyoverdine (gray), P. aeruginosa (black), or E. coli OP50 (white) in liquid as compared to untreated worms (which remained on NGM agar with E. coli OP50 food). (C) qRT-PCR analysis response to phenanthroline, with fold changes normalized to worms exposed to solvent control (DMSO) in liquid. (D) Venn diagram of genes upregulated after exposure to pyoverdine, P. aeruginosa, and phenanthroline in liquid. (E) Statistical significance of overlaps between microarray conditions in A and D based on hypergeometric probability. Asterisks in (B) indicate significant difference from E. coli OP50 (p-value < 0.01, based on Student's t-test). Error bars in B-C represent SEM of 3 independent biological replicates.
