
Figure 4.
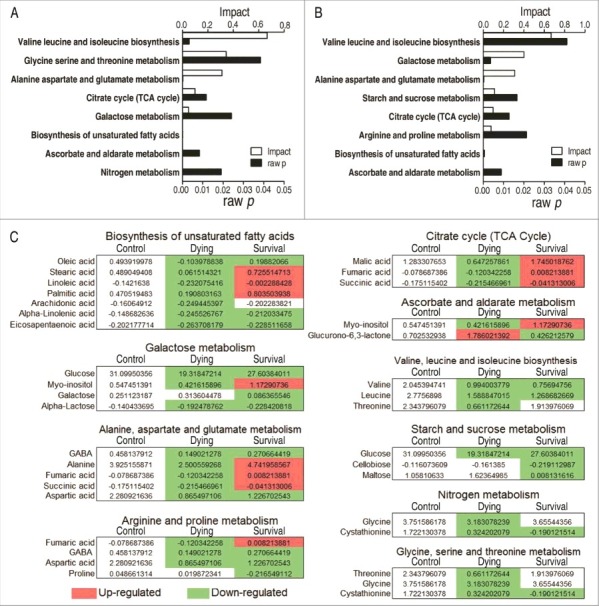
Pathway enrichment. A and B, Pathway enrichment of varied metabolites in the dying group (A) and in the survival group (B). Significant enriched pathways are selected to plot. C, Integrative analysis of metabolites in significantly enriched pathways. Red color and green color indicate increased and decreased metabolites, respectively.