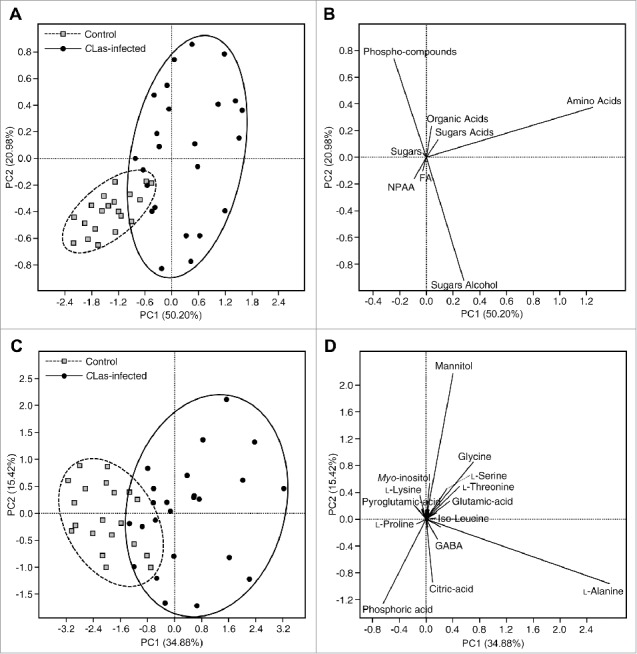
Figure 2.

Principal components analysis (A) and its associated loading plot (B) showing the distribution of uninfected and Candidatus Liberibacter asiaticus-infected Diaphorina citri using the concentrations of the main metabolites groups. Principal components analysis (C) and its associated loading plot (D) showing the distribution of uninfected and Candidatus Liberibacter asiaticus- infected Diaphorina citri using the concentrations of individual metabolites groups (n = 20). In panel (D), Some of the detected compounds names have been deleted from the loading plot for better presentation.
