Figure 4.

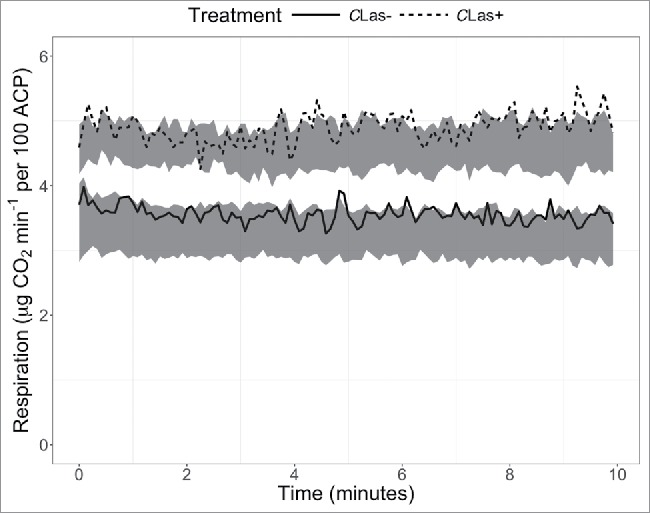
Respiration of CLas-infected and uninfected D. citri recorded over 10 min. Gray bands represent 95% confidence intervals (n = 6), and lines represent single representative samples.

Respiration of CLas-infected and uninfected D. citri recorded over 10 min. Gray bands represent 95% confidence intervals (n = 6), and lines represent single representative samples.