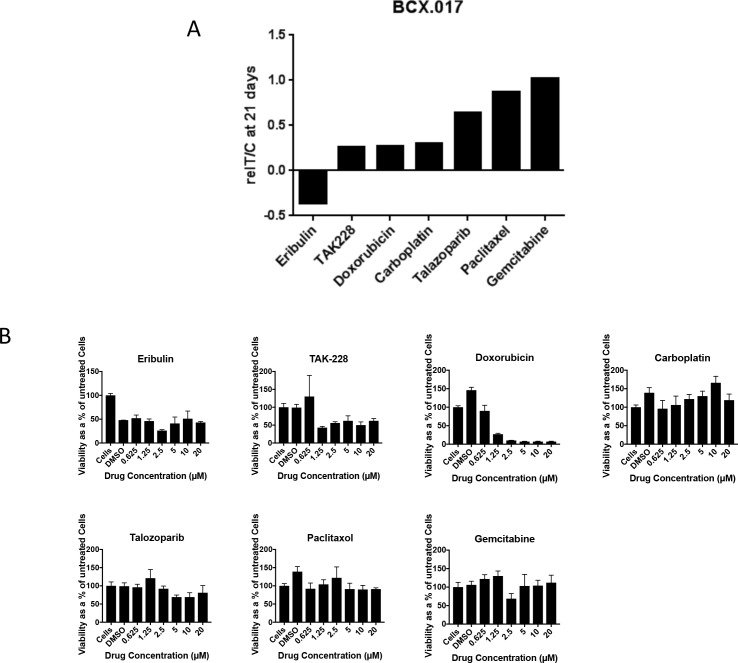
Fig 6. Comparative drug response profile between IBC PDX Bcx017 mouse model and Bcx017 PDXEx tissue model.
A) Actively growing (~200–350 mm3) implants in mice were grouped and treated with the indicated drugs for 21days. The graph summarizes data from a previously published in vivo study [69]. B) Tumor cells tagged with a nanoparticle assembly of iron oxide and iron nanoparticles cross-linked with poly-L-lysine (NanoshuttleTM) were bio-printed into ultra low attachment plates. The PDXEx bio-print was treated with the indicated drugs at the indicated dose range for 5 days.

