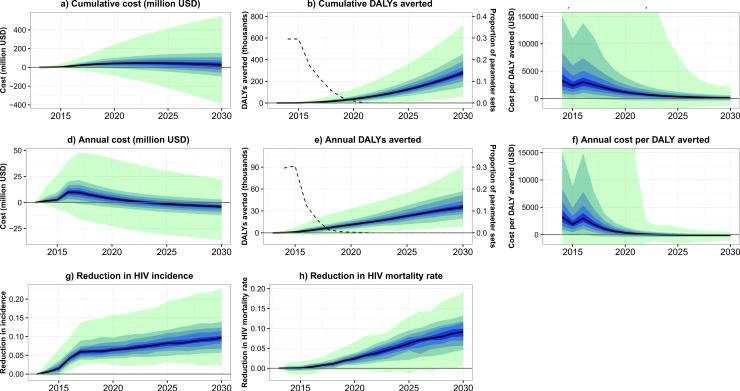
Fig 2. Costs and effects over time of the change in CD4 threshold.
a) Total additional costs over time (cumulative). b) Total DALYs averted over time (cumulative) (bands) and proportion of parameter sets where the number of DALYS averted was negative (dashed line, second axis). c) Total cost per DALY averted over time (parameter sets are excluded if the cumulative number of DALYs averted by that year are negative). d) Annual additional costs over time. e) Annual DALYs averted over time (cumulative) (bands) and proportion of parameter sets where the number of DALYS averted was negative (dashed line, second axis). f) Annual cost per DALY averted over time (parameter sets are excluded if the number of DALYs averted in that year are negative). g) Reduction in annual HIV incidence with the change in CD4 threshold, compared to scenario with no change. h) Reduction in annual HIV mortality rates with the change in CD4 threshold, compared to scenario with no change. Black lines show the median model output, and blue/green bands show 10% quantiles of model outputs, from the 2000 parameter sets.

