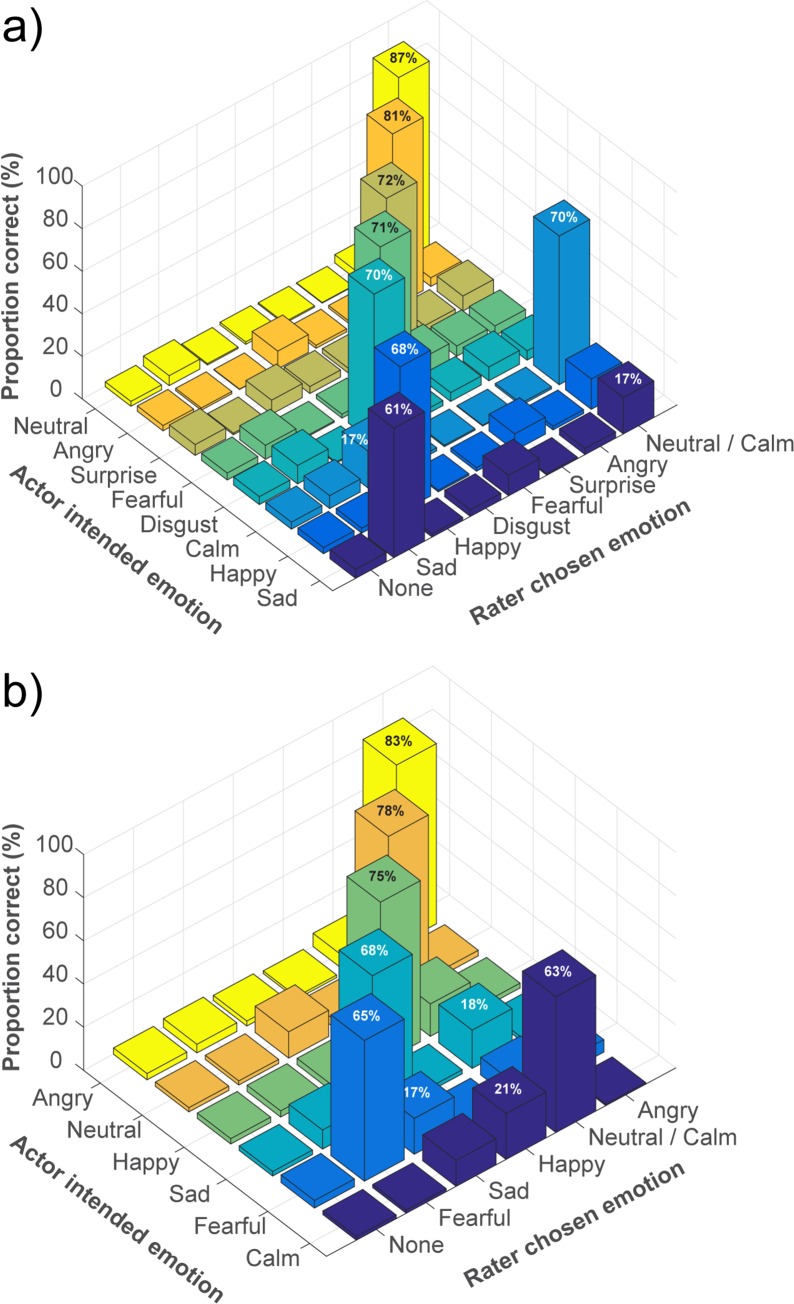
Fig 4. Confusion matrices of emotional validity.
The confusion matrices present mean proportion correct scores for actors’ intended emotions as per rater chosen emotion labels for: (A) Speech (N = 43200 ratings), and (B) Song (N = 30360 ratings). Proportion scores that equal or exceed 15% are notated on the corresponding bar.

