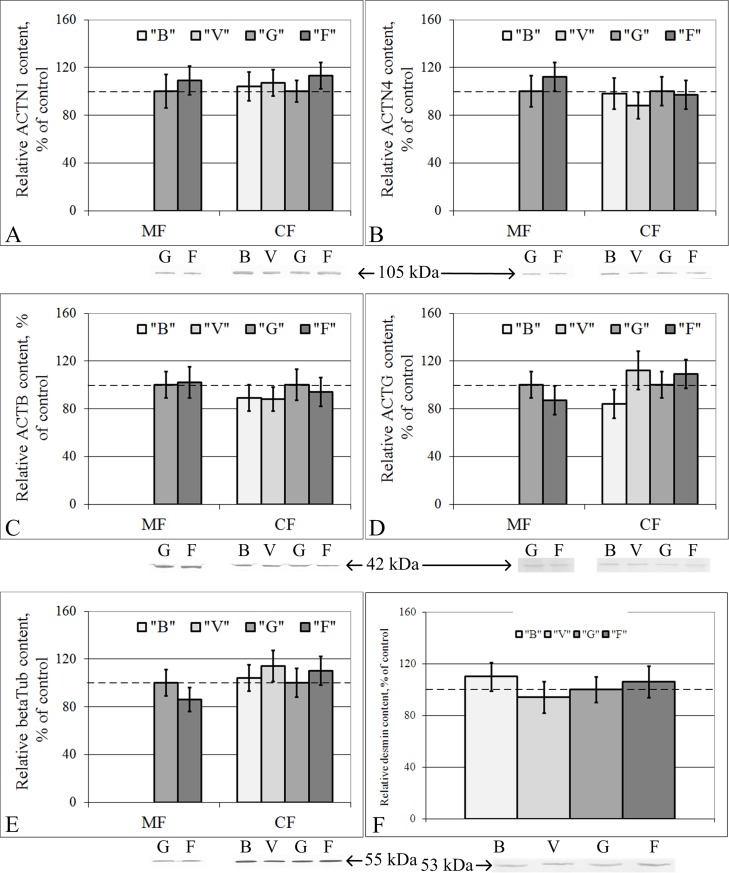
Fig 2. Relative contents of cytoskeletal proteins in the membrane (MF) and cytoplasmic (CF) fractions of lung cells with typical Western blot images.
(A) Alpha-actinin-1. (B) Alpha-actinin-4. (C) Beta-actin. (D) Gamma-actin. (E) Beta-tubulin. (F) Desmin. “B”–basal control group, “V”–vivarium control group, “G”–ground control group (level marked by dotted line), “F”–flight group. The values used to build graphs represented in the S2 Table. There were no changes of cytoskeletal proteins contents in the membrane and cytoplasmic fractions of the lung tissue.

