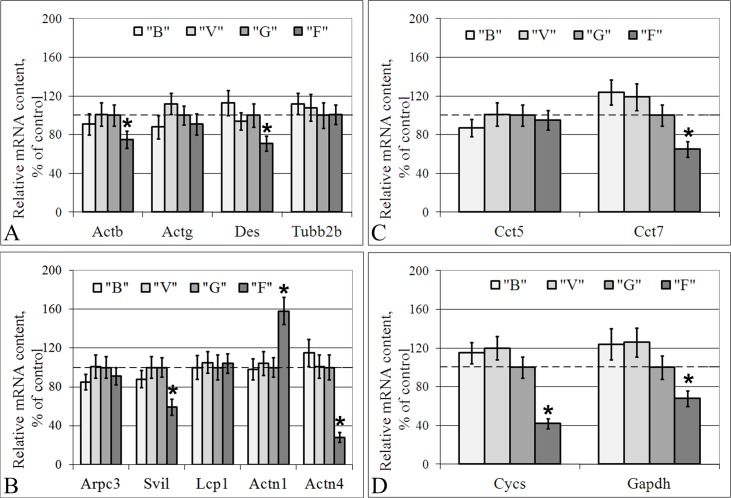
Fig 4. Relative mRNA content of genes (qPCR data) that encode cytoskeletal and metabolic proteins in the lung cells.
(A) The actin isoforms, the microfilaments component; desmin, the intermediate filaments component; subunit 2B of beta-tubulin, the microtubules component. (B) The actin-binding proteins. (C) The tubulin-binding proteins. (D) The metabolic proteins, cytochrome c and glyceraldehyde 3-phosphate dehydrogenase. “B”–basal control group, “V”–vivarium control group, “G”–ground control group (level marked by dotted line), “F”–flight group. *–p < 0.05 in comparison with group “G”. The values used to build graphs represented in the S4 Table.

