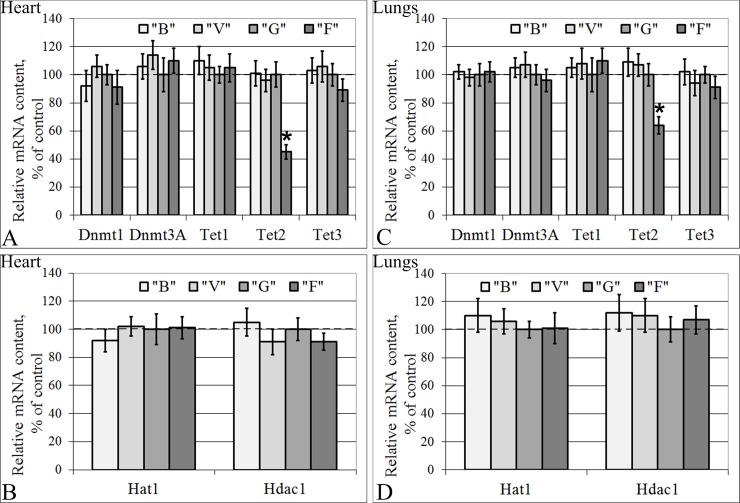
Fig 7. Relative mRNA contents of genes (qPCR data) that encode some regulators of transcription.
(A) Heart: the cytosine methylases Dnmt1 (S-phase methylation) and Dnmt3A (de novo methylation) and the cytosine demethylases (Tet1, Tet2, Tet3). (B) Heart: the histone aminotransferase 1 Hat1 and Hdac1 (histone deacetylase 1, 2, 3, 4, 6, 9). (C) Lungs: Dnmt1 and Dnmt3A and Tet1, Tet2 and Tet3. (D) Lungs: Hat1 and Hdac1. “B”–basal control group, “V”–vivarium control group, “G”–ground control group (level marked by dotted line), “F”–flight group. *–p < 0.05 in comparison with group “G”. The values used to build graphs represented in the S6 and S7 Tables.

