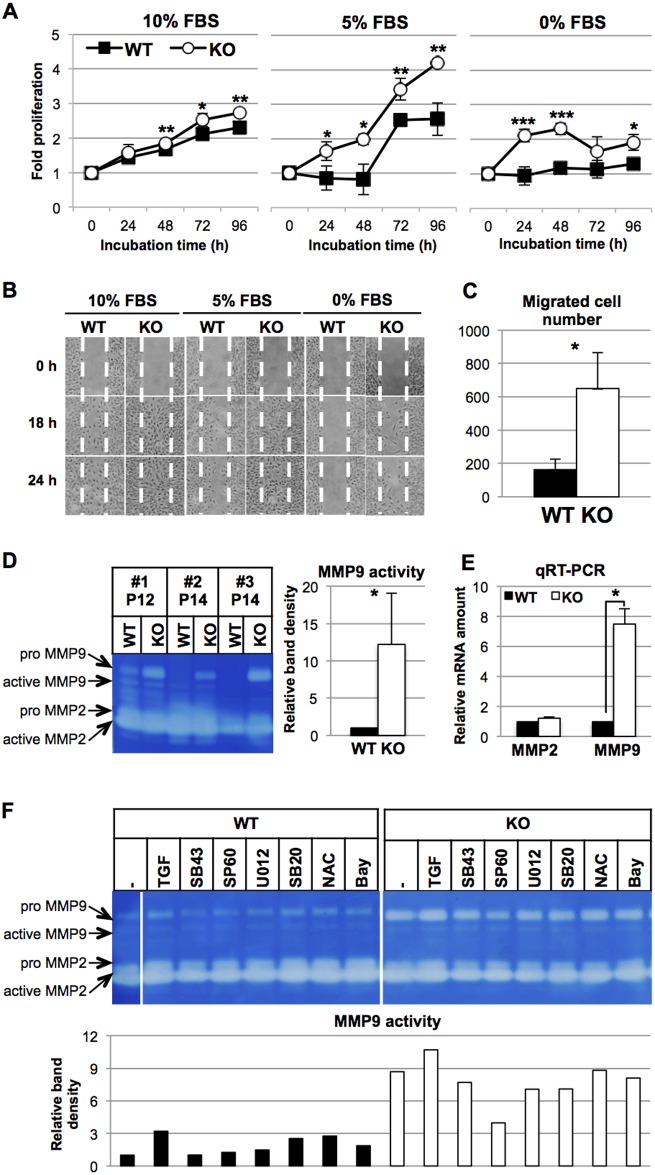
Fig 3. Phenotypic characterization of isolated HtrA1-/- mouse VSMCs.
(A) Rapid proliferation of HtrA1-/- VSMCs. HtrA1-/- (KO) and wild type (WT) VSMCs were cultured in medium containing 10%, 5%, or 0% FBS as indicated. Cell proliferation was assayed at the indicated time points (0 h was set at 15 h after plating). Points in the graphs represent means ± SD (n = 3–4). The experiments were carried out independently for three different batches of WT and HtrA1-/- VSMCs at the matching passage. The data shown are a representative result from cells at passage 7. (B-C) Rapid migration of HtrA1-/- VSMCs. (B) Cell migration was analyzed by the wound-healing assay. Cells were cultured in medium containing 10%, 5%, or 0% FBS as indicated. Photographs were taken at the indicated time points. White dotted lines indicate boundaries of the initial wounded area. The experiment was repeated three times and representative results are shown. Cells at passage 13 were used. (C) Cell migration was analyzed by a modified Boyden chamber assay. Cells were cultured in the chamber in medium containing 10% FBS for 24 h. The number of cells that migrated through the membrane was counted after DAPI staining. The bars are means ± SD (n = 3). The experiment was repeated twice times and representative results are shown. Cells at passage 12 were used. (D-E) Production of MMPs by isolated HtrA1-/- mouse VSMCs. (D) Increased MMP9 activity in the culture media of HtrA1-/- VSMCs. WT and HtrA1-/- VSMCs were cultured in medium containing 0.5% FBS. After 24 h, the culture medium was recovered. The cells were also harvested, and cell lysates were analyzed by Western blot for tubulin content. The media, whose volumes were normalized by tubulin, were loaded onto a zymography gel. Three different batches of WT and HtrA1-/- VSMCs at the matching passage (passage 12, P12 or 14, P14) were analyzed. The zymogram was analyzed by densitometer and the results are presented in the bar graph on the right. MMP9 activity of WT VSMCs was set to 1, and the relative MMP9 activity of HtrA1-/- VSMCs is shown as mean ± SD. (E) MMP mRNA expression in WT and HtrA1-/- VSMCs. RNA was extracted from cells that were harvested as described in D. MMP2 and MMP9 mRNA were measured by quantitative RT-PCR and normalized with GAPDH. The relative expression levels in HtrA1-/- VSMCs were calculated using the levels of MMP2 and MMP9 mRNA in WT VSMCs as 1. Values represent mean ± SD (n = 3). Cells at passage 10 were used. Statistical significance in A, C, D, and E was determined by Student’s t-test. *; p <0.05. **; p < 0.01. ***; p <0.001. (F) Effects of TGF-β1, a radical scavenger, or signaling inhibitors on MMP9 activity of WT and HtrA1-/- VSMCs. VSMCs were cultured in medium containing 0.1% FBS and treated for 24 h with various reagents as indicated. The culture supernatants were recovered and applied to zymography gels as described in D. The same samples (culture supernatants of untreated WT and HtrA1-/- VSMCs) were applied to both gels and used as standards to compare activities on the separate gels. The uncropped zymograph pictures are shown in S4 Fig. MMP9 activity in the culture supernatant of untreated WT was set to 1 (leftmost lane) and relative activities for treated WT and HtrA1-/- VSMCs were calculated and are presented in the bar graph in the lower panel. Cells at passage 14 were used. TGF = TGF-β1. SB43 = SB431542, a TGF-βR1 antagonist. SP60 = SP600125, a JNK inhibitor. U012 = U0126, a MEK1/2 (ERK1/2 upstream) inhibitor. SB20 = SB203580, a p38 MAPK inhibitor. NAC = N-acetylcysteine, a ROS scavenger. Bay = Bay11-7082, an NF-κB inhibitor. Black bars represent WT VSMCs; white bars represent HtrA1-/- VSMCs.

