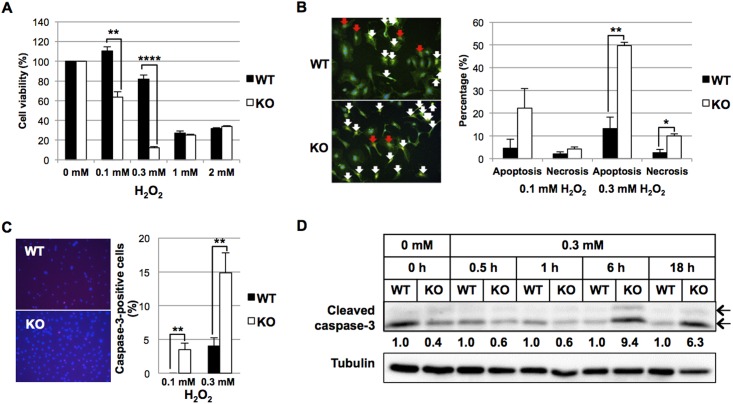
Fig 5. Effect of oxidative stress on wild type and HtrA1-/- mouse VSMCs.
Wild type (WT) and HtrA1-/- (KO) VSMCs at passage 10 were starved in medium containing 0.1% FBS for 24 h. (A) Effect of H2O2 on cell viability of WT and HtrA1-/- mouse VSMCs. Cells were treated with the indicated concentrations of H2O2 for 24 h in medium containing 0.1% FBS. Cell viability was examined using Cell Count Reagent SF (Nacalai Tesque). (B) Effect of H2O2 on cell death of WT and HtrA1-/- mouse VSMCs. Cells were treated with 0.1 or 0.3 mM H2O2 for 6 h in medium containing 0.1% FBS. Cells were triply stained with Apoptotic/Necrotic/Healthy Cells Detection Kit (PromoKine) as follows: Hoechst 33342 (blue) indicating the entire cell population, FITC-Annexin V (green) indicating apoptotic cells and Ethidium homodimer III (red) indicating necrotic cells. Representative images of merged data are shown in the left panel. Apoptotic (white arrows) and necrotic (red arrows) cells were counted, and their percentages of the total cell number were calculated and are presented in the bar graph in the right panel. (C) Effect of H2O2 on apoptosis of WT and HtrA1-/- mouse VSMCs. Cells were treated with 0.1 or 0.3 mM H2O2 for 6 h in medium containing 0.1% FBS. Cells were then immunostained with anti-cleaved caspase-3 antibody. Representative images of WT and HtrA1-/- VSMCs treated with 0.3 mM H2O2 are shown in the left panel. Caspase-3-positive cells were counted, and their percentages of the total cell number were calculated and are presented in the bar graph in the right panel. (D) Effect of H2O2 on the expression of cleaved caspase-3 on WT and HtrA1-/- mouse VSMCs. WT and HtrA1-/- VSMCs were treated with 0.3 mM H2O2 in medium containing 0.1% FBS. Cell lysates were prepared at the time points indicated, separated by SDS- PAGE, and analyzed by Western blot for cleaved caspase-3. Band density was analyzed by densitometry. The expression levels were normalized with tubulin, and relative expression levels were calculated and are shown below the upper panel. The anti cleaved caspase-3 antibody detected the large fragments (17/19 kDa, indicated by arrows). Band densities of both were analyzed by densitometry, and summated. Bars in A, B, and C represent means ± SE (n = 3). Statistical significance was determined by Student’s t-test. *; p <0.05. **; p <0.01. ****; p < 0.0001.

