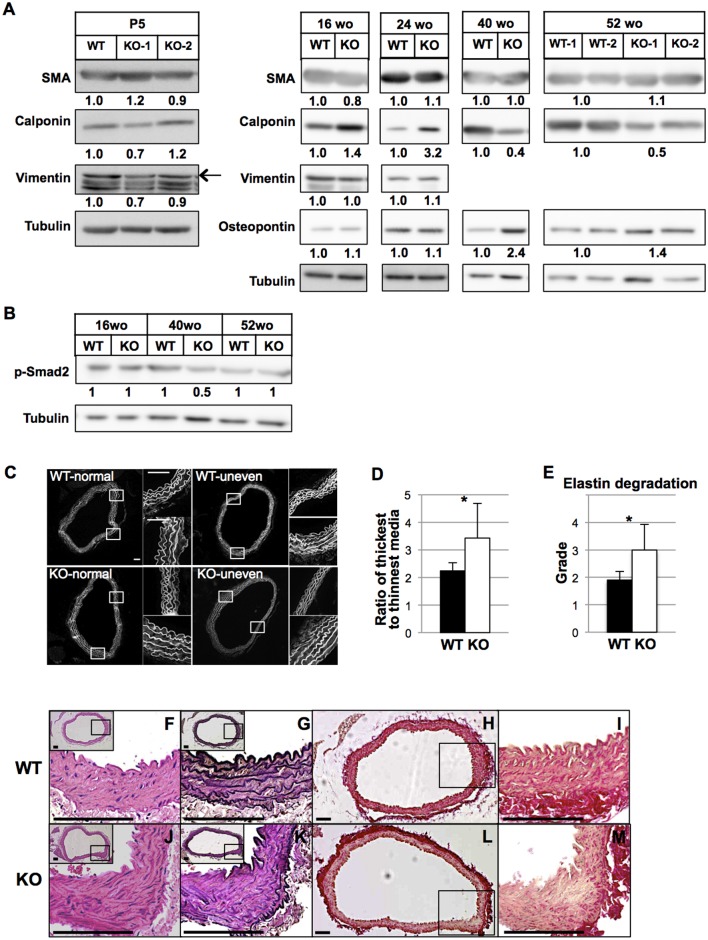
Fig 6. Characterization of in vivo VSMCs in the aorta of HtrA1-/- mouse and histological abnormalities of aortas isolated from HtrA1-/- mice.
(A) Expression of VSMC contractile and synthetic markers in aortas of wild type (WT) and HtrA1-/- (KO) mice. The entire descending thoracic aortas from three or four mice of 5 days old (P5) or 16, 24, 40, or 52 weeks old (wo) were combined and tissue extracts were prepared. The extracts were separated by SDS-PAGE and Western blot analysis was performed with VSMC markers, as indicated. Expression levels were normalized with tubulin, and relative expression levels were calculated and are shown below each panel. Two different batches of aortic extract from P5 HtrA1-/- mice (KO-1 and KO-2), 52-wo wild type mice (WT-1 and WT-2), and HtrA1-/- mice (KO-1 and KO-2) were analyzed. The arrow in the P5 blots shows the vimentin band; bands below the arrow are nonspecific proteins. (B) Phosphorylation of Smad2 in aortas of WT and HtrA1-/- mice. Tissue extraction, SDS-PAGE, and Western blot were carried out as described in A using an antibody against p-Smad2. Relative expression levels after tubulin normalization are shown below the upper panel. (C-D) Uneven thickening of aortic media of 52-wo HtrA1-/- mice. Cross sections from the upper half of the descending aorta were stained with elastica van Gieson (EVG), hematoxylin and eosin (HE), or picrosirius red. Cross sections were stained with HE, and autofluorescence images were obtained with a fluorescence microscope to visualize elastin structures. Upper and lower panels show representative images of normal aorta or aorta with uneven thickening in WT and HtrA1-/- mice, respectively (C). Two small images on the right side of each large image show magnified (4x) views of the boxed areas and represent the thickest (lower panels) and the thinnest (upper panels) areas. Bars = 100 μm. Three adjacent sections were analyzed for each aorta, and the incidence of uneven thickening and the ratio of thickest-to-thinnest media were calculated (D). Bars in D represent means ± SD (WT, n = 10; HtrA1-/-, n = 8). Statistical significance was determined by Student’s t-test. *; p <0.05. (E) Elastic fiber degradation in the aortic media of 52-wo HtrA1-/- mice. Grading of elastic fiber degradation was carried out using autofluorescence images of HE-stained sections based on a reported method [45]; the details are described in the Supplementary methods in S1 File. Pictures depicting typical images of the WT and HtrA1-/- aortas are shown in S6 Fig. Bars represent means ± SD (WT, n = 10; HtrA1-/-, n = 8). Statistical significance in E was determined by nonparametric U-test (Mann-Whitney). *; p <0.05. (F-M) Elastic fiber degradation and decrease in collagens in 52-wo HtrA1-/- mouse aortas. Cross sections were stained with HE (F, J), EVG (G, K), or picrosirius red (H, L) for collagens. Insets in F, G, J, and K depict the entire cross sections, with boxed areas that are magnified in the main images. I and M show higher magnifications of the boxed areas of H and L, respectively. Bars = 100 μm.

