
Fig 3. Based on olfactory cues, Drosophila do not prefer the yeast associated with their winery area.
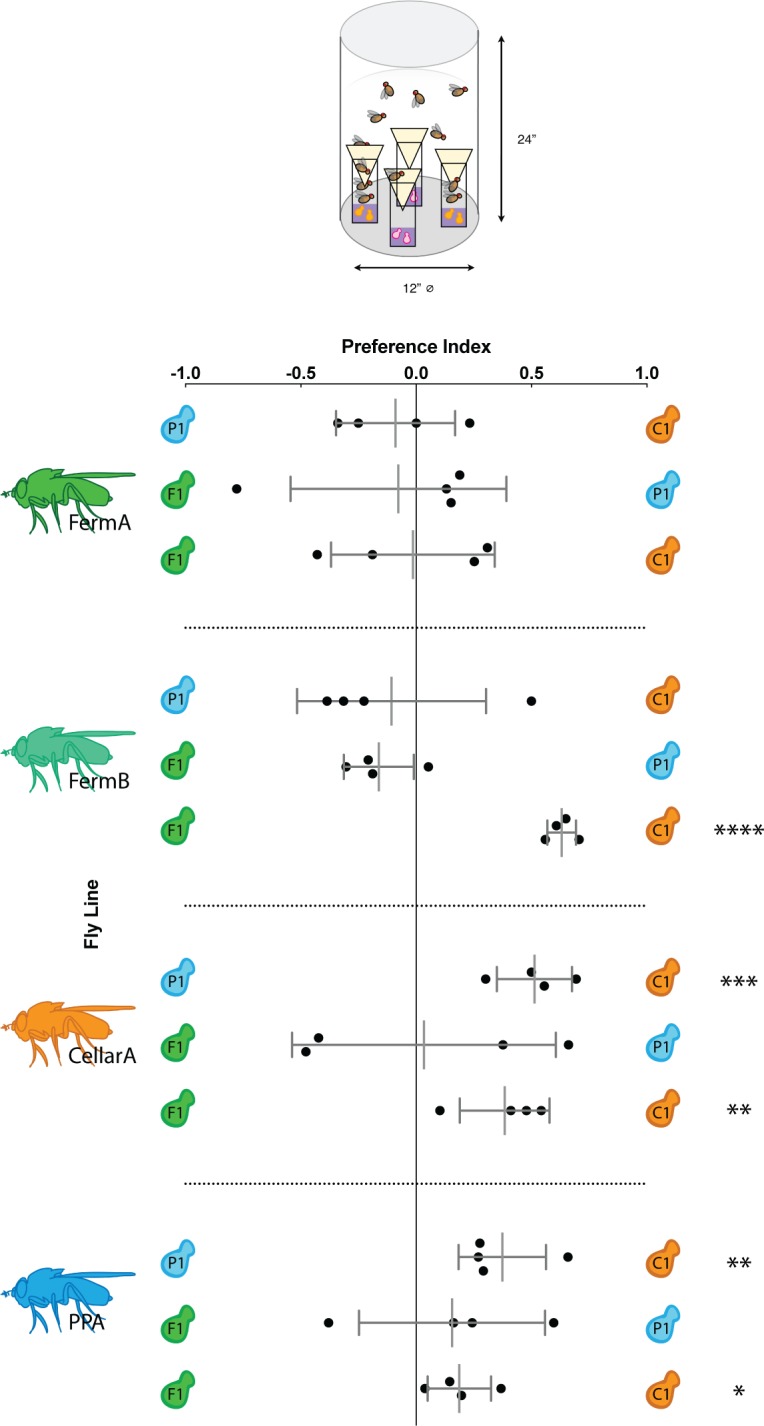
Drosophila lines tested are denoted by fly icons to the left and yeast species being compared are denoted by yeast symbols on the left and right axes. For a given comparison between yeast species A and B, a positive PI indicates a preference for yeast A, a negative PI indicates a preference for B, and a PI of 0 indicates no preference. Black dots indicate trial replicates. Short grey lines represent standard deviation and longer grey lines represent the mean of all trials. Stars to the left denote significantly different preferences between the two yeast species being tested (multiple t-tests with a Bonferroni correction, *: p<0.05, **: p<0.01, ***: p<0.001, ****: p<0.0001).