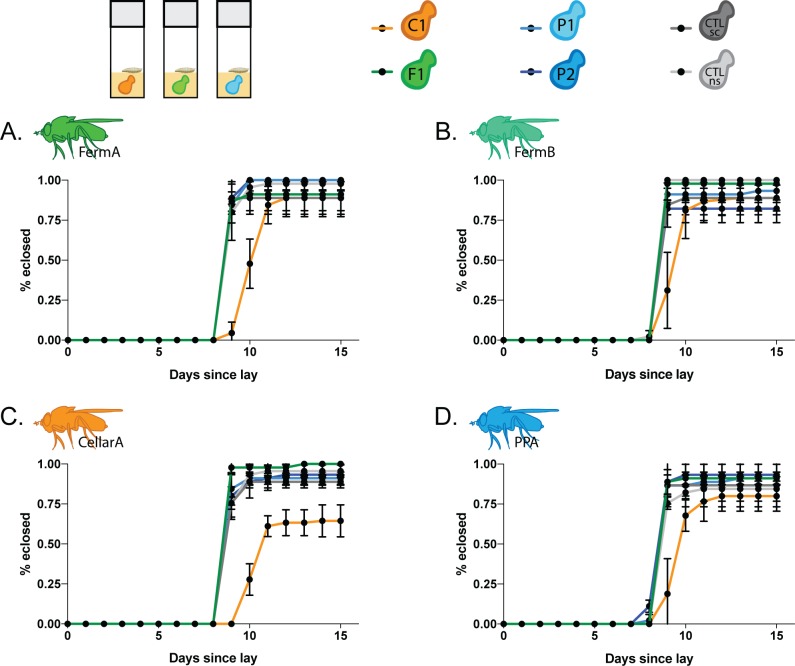
Fig 5. Some yeasts are more suitable for Drosophila development but do not follow a winery area specific pattern.
Short, horizontal black lines represent standard deviation and black points represent the mean of all trials. Accompanying statistics for larval development time in S5 Table. Larval development of fly lines (A) FermA (B) FermB. (C) CellarA. (D) PPA.

