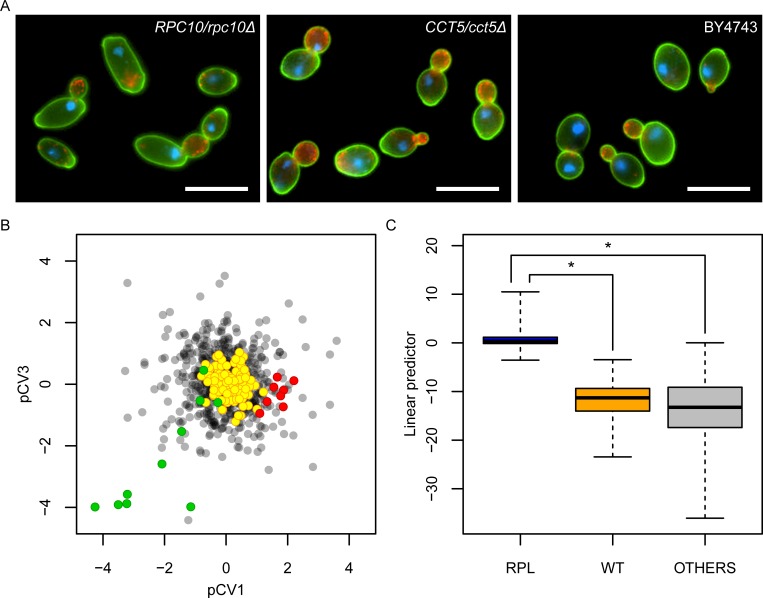
Fig 2. Function-specific haploinsufficiency phenotypes.
(A) Images of heterozygous mutants for RNA pol II (RPC10/rpc10Δ), chaperonin CCT (CCT5/cct5Δ), and wild type. Cells were stained with FITC-conjugated concanavalin A for cell wall (green), rhodamine-phalloidin for actin (red), and DAPI for nuclear DNA (blue), and presented with pseudo-coloring. Scale bar indicates 10 μm. (B) Biased distribution of heterozygous mutants in phenotypic space. After CCA was performed, scores of CVs of the haploinsufficiency phenotypes were plotted in pCV1/pCV3 orthogonal space. Green and red circles indicate mutants heterozygous for RNA pol II and chaperonin CCT, respectively. Gray and yellow circles indicate the remaining heterozygotes and 114 wild-type replicates, respectively. (C) Linear predictor of logistic regression showing phenotype specificity for the cytosolic large ribosomal subunit (GO:0022625) heterozygous mutants (S3 Data). Linear predictor was calculated by linear combinations of 10 pCVs (pCV1, pCV2, pCV4, pCV5, pCV12, pCV13, pCV17, pCV18, pCV19, and pCV21) selected by a combinational optimization. Asterisk indicates significant difference (P < 0.05 after Bonferroni correction by likelihood ratio test). CCA, canonical correlation analysis; CCT, chaperonin containing TCP-1; DAPI, 4’,6-diamidino-2-phenylindole; FITC, fluorescein isothiocyanate; pCV, phenotype canonical variable; RNA pol II, RNA polymerase II core complex; RPL, ribosomal protein of the large subunit; WT, wild type.

