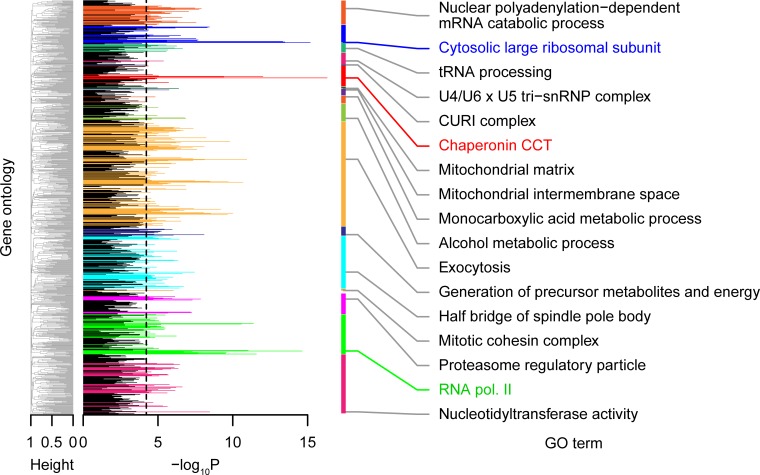
Fig 3. Significant correlation probabilities between gene functions and haploinsufficiency phenotypes.
Colored peaks indicate GO terms with significant logistic regression coefficients (P < 0.05 after Bonferroni correction, likelihood ratio test) of haploinsufficiency phenotypes. GO terms with minimum P values in each GO group are shown on the right side (S3B Table). Cluster dendrograms on the left side were constructed based on the frequency of genes in common between GO terms to classify GO terms into representative groups. Black dashed line indicates threshold of P < 0.05 after Bonferroni correction by the likelihood ratio test. CCT, chaperonin containing TCP-1; CURI, CK2-Utp22-Rrp7-Ifh1; GO, gene ontology; RNA pol II, RNA polymerase II core complex; snRNP, small nuclear ribonucleo protein.

