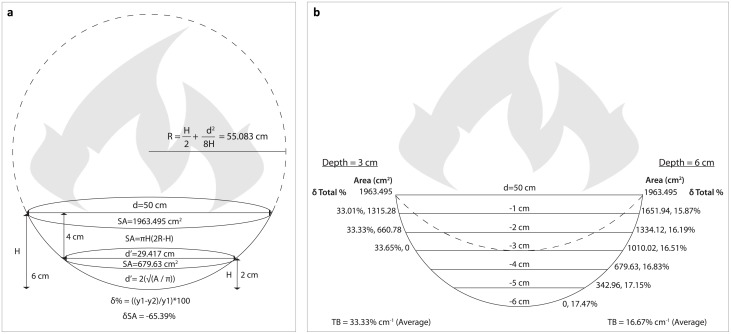
Fig 3. Diagrams showing the logic behind thermal buffering (TB) in our model.
This is the rate at which extant lithic scatters are potentially heated in subsequent occupations. a) Assuming the 250°C isotherm of a 50-cm-wide hearth is able to penetrate 6 cm into the substrate, 100% of lithic fragments lying within the hearth’s footprint at the surface would be thermally altered, while <35% of the same lithic scatter would be thermally altered if buried 4 cm below the hearth due to the reduction in surface area exposed to the heat. b) The ‘δ Total %’ value per unit of depth change increases as the depth of penetration of the 250°C isotherm becomes more shallow and/or the unit of depth (corresponding in our model to the amount of sediment deposited between occupations) is increased. For simplicity, we use the average δ Total % value, rounded to the nearest whole value, as the TB value in our model. See S3 Table for TB value calculator based on these diagrams. (Note: Figures are not to scale. d = diameter, SA = surface area, H = height of the spherical cap).

