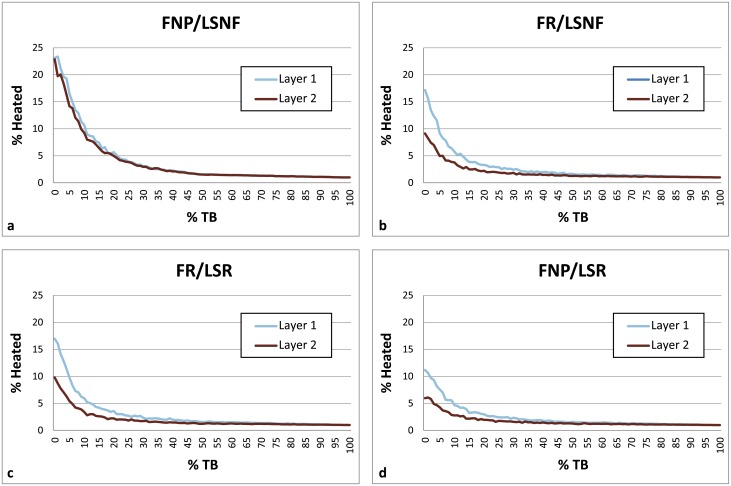
Fig 6. Charts comparing fire and lithic scatter placement scenarios between Layer 1 and Layer 2.
Parameters: 1 fire, fire size 1, 4 lithic scatters, 30 occupations, 0–100% TB, 1% introduced lithics. The heated lithic percentages and curves for the FR/LR and FR/LU settings are virtually identical to those seen in the FR/LSNF and FR/SLR charts, while the plots using the FNP/LR and FNP/LU settings are nearly identical to those seen in the FNP/LSR chart, so these were not included here but were included in S1 Fig in the Supporting Information. FNP = Fire near previous, FR = Fires random, LSNF = Lithic scatters near fire, LSR = Lithic scatters random, LR = Lithics random, LU = Lithics uniform, TB = Thermal buffering.

