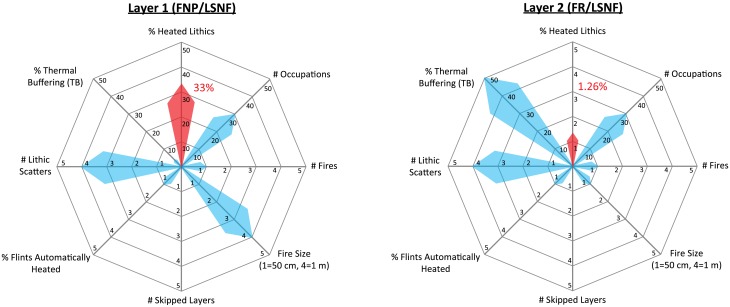
Fig 14. Rose plots providing visual representations of the Layer 1 and Layer 2 occupation scenarios described in section 4.2.
The red arrows and associated red numbers indicate the resultant percentages of heated lithics produced in each scenario, while the values of other parameters are depicted as blue arrows. Note the different scales for heated lithics between Layer 1 and Layer 2. FNP = Fire near previous, FR = Fires random, LSNF = Lithic scatters near fire.

