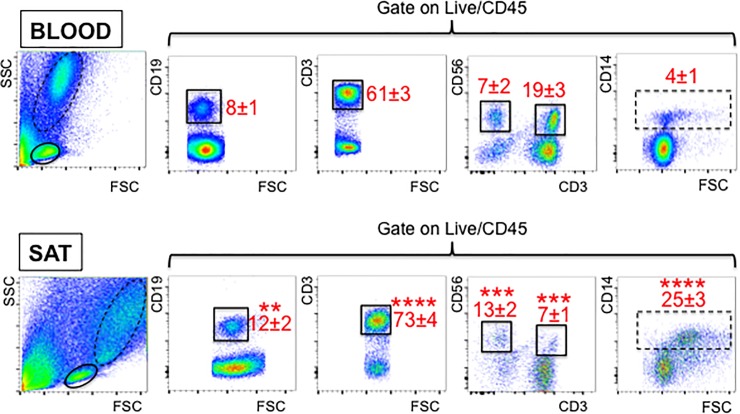
Fig 1. Frequencies of immune cells in the obese SAT versus blood.
The blood and the SVF from the SAT of the same individuals (n = 20, representing all individuals recruited) were stained to evaluate the frequencies of B, T, NK, NKT as well as monocytes and MΦ. Gating strategies and a representative dot plot from one individual are shown. B, T, NK, NKT are gated on the continuous line, whereas monocytes and MΦ are gated on the dotted line. Means±SE are shown in red. Mean comparisons between groups were performed by Student’s t test (two-tailed). **p<0.01, ***p<0.001, ****p<0.0001.

