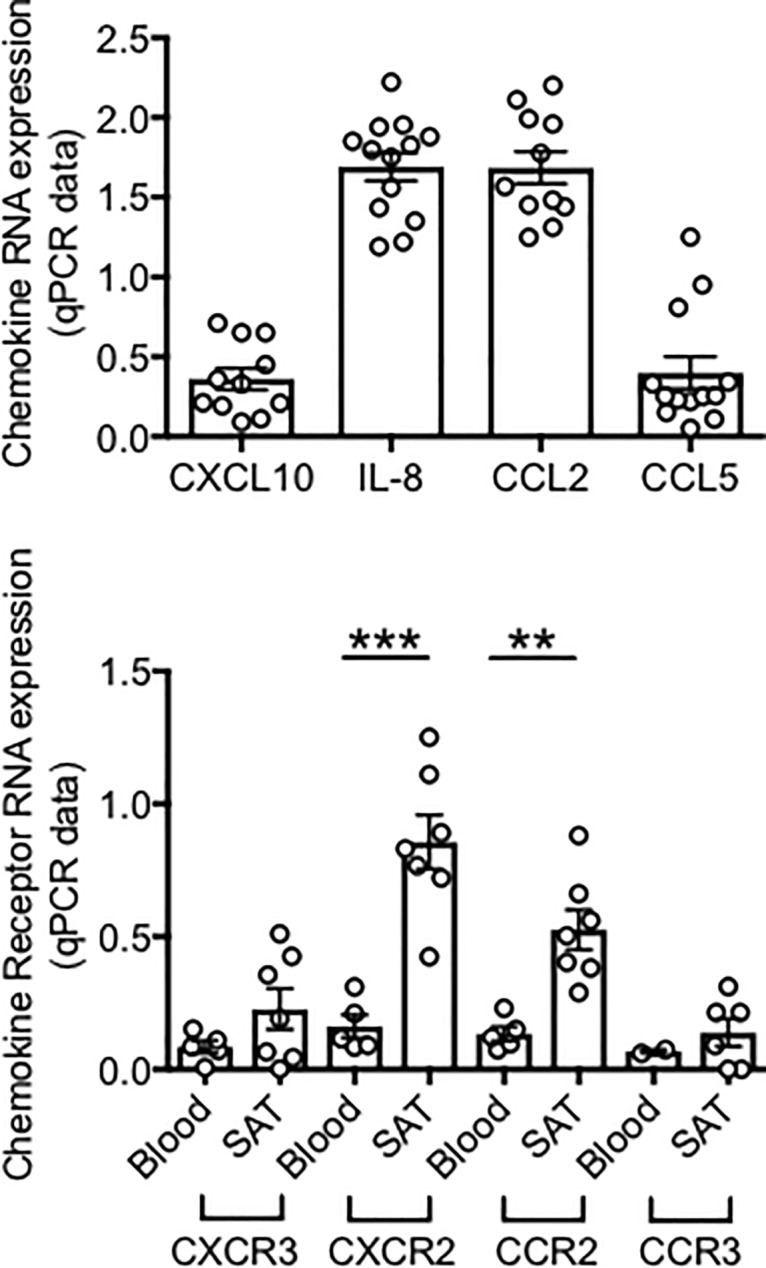
Fig 3. RNA expression of chemokines in adipocytes and corresponding chemokine receptors in the obese SAT versus blood.

Top. Adipocytes (AD) were sonicated for cell disruption in the presence of TRIzol to separate the soluble fraction (used for RNA isolation) from lipids and cell debris. Results show qPCR values (2-ΔΔCt) of CXCL10, IL-8, CCL2, CCL5 RNA expression. Bottom. The SVF were resuspended in TRIzol. AD and SVF were from the same obese individuals. PBMC (blood) were from obese individuals age-, gender- and BMI-matched. Results show qPCR values (2-ΔΔCt) of CXCR2, CXCR3, CCR2, CCR3 RNA expression. Mean comparisons between groups were performed by Student’s t test (two-tailed). **p<0.01, ***p<0.001.
