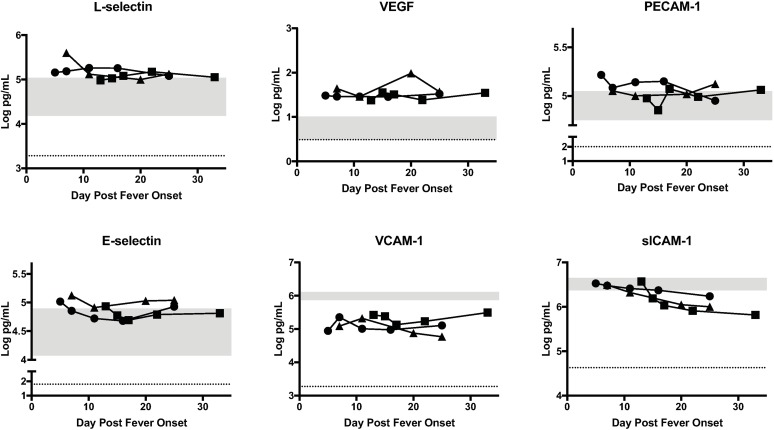
Fig 4. Statistically significant biomarkers of endothelial function in RVF cases.
The concentration of each biomarker in each patient is plotted as function of day post fever onset; Case 1 (square), Case 2 (circle), Case 3 (triangle). The grey area represents the range of the biomarker concentration that was detected in 8 normal healthy individuals. The dotted line is the limit of detection of the assay, which is the lowest level at which the assay can accurately detect the presence of the biomarker.

